Charts & diagrams
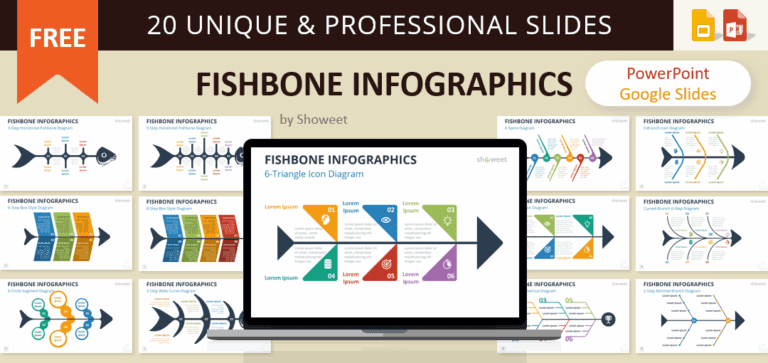
Fishbone Infographics for PowerPoint and Google Slides
Present causes, effects, and processes with vibrant, editable diagrams that keep your audience focused and engaged.
Free creative templates for PowerPoint and Google Slides
Present causes, effects, and processes with vibrant, editable diagrams that keep your audience focused and engaged.

Enhance your slides with professional Cycle Pin Diagrams, offering versatile 5-8 option layouts for compelling visual storytelling.

Download the main marketing models for your PowerPoint and Google Slides presentations. An essential marketing toolset for the managers who want to optimize their strategic business decisions. Also, a great resource for the students to learn and understand marketing concepts and tools.
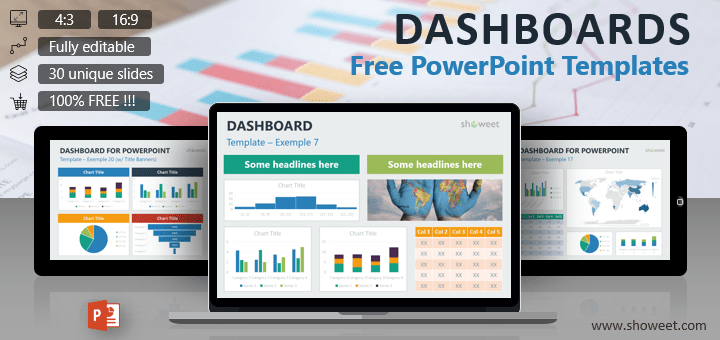
Presenting a lot of data in a legible and visually appealing way is a tricky exercise. This free collection of ready and easy-to-use dashboards for your PowerPoint presentations will make your life easier.
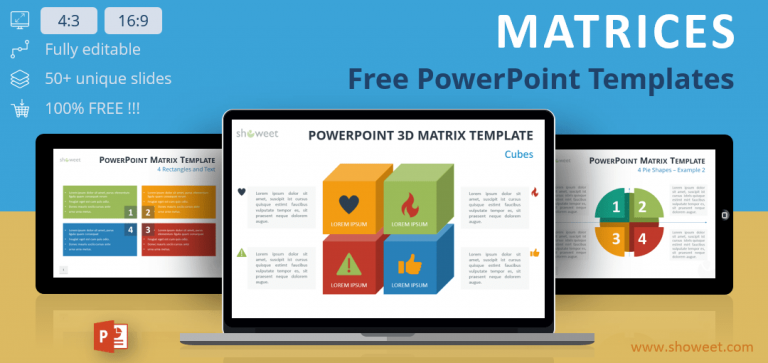
Give a creative and impactful facelift design to your business strategy and marketing matrices.
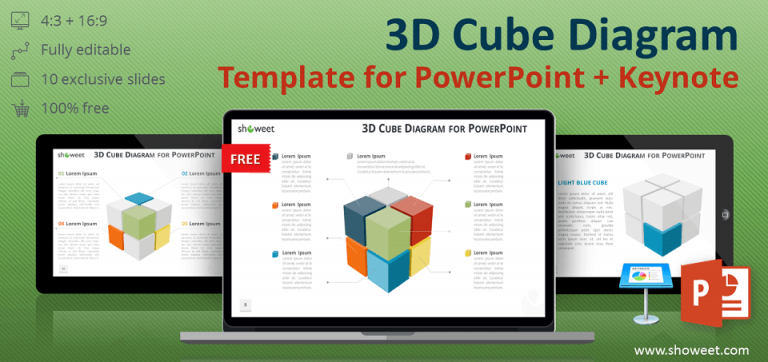
Free 3D cube diagram for PowerPoint and Keynote. Ready-to-use professional graphics for your presentations. 10 powerful slides.
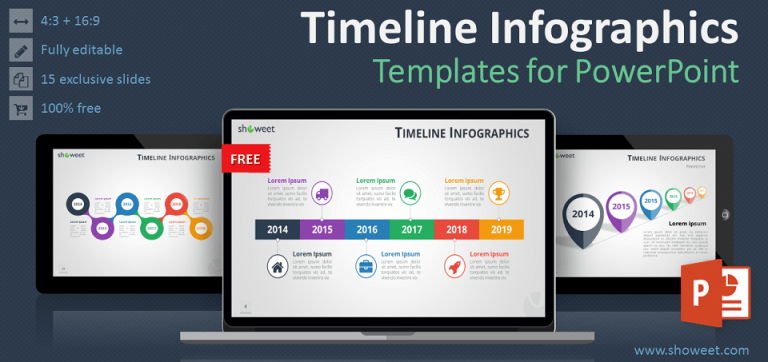
Free timeline infographics templates for PowerPoint. Ready-to-use professional design templates for your presentations. 15 creative slides.
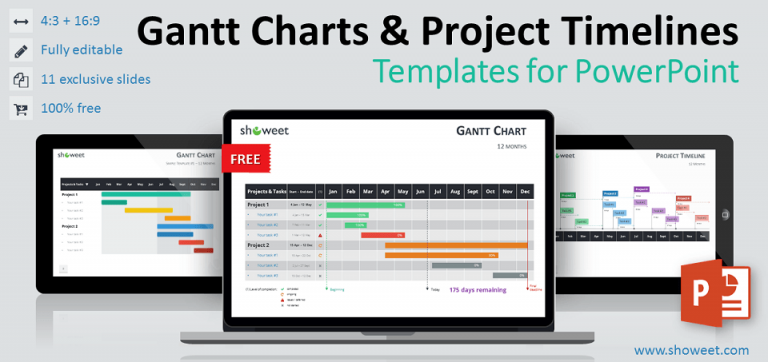
Free Gantt charts and project timelines templates for PowerPoint. Professional looking presentation templates.