
Maps
Map of France Templates for PowerPoint
Free editable map of France for PowerPoint presentations. Large resolution outline map templates. PPTX document with 5 professionally designed and ready-to-use slides.
Creative and free PowerPoint templates
Free editable map of France for PowerPoint presentations. Large resolution outline map templates. PPTX document with 5 professionally designed and ready-to-use slides.
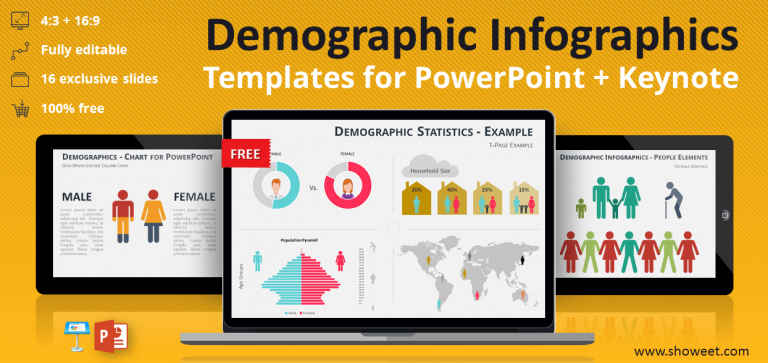
Free collection of demographic infographic elements for PowerPoint and Keynote. Includes 16 ready-to-use editable template slides for your business presentations.
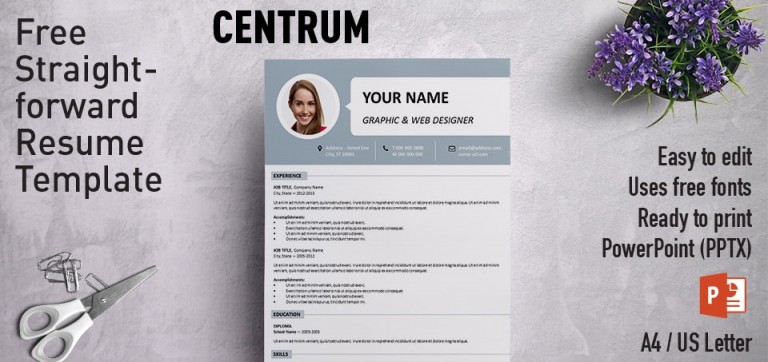
Centrum is a simple, easy to read and straight to the point free resume template. 1-column single page resume template with colored banner header with a speech bubble.
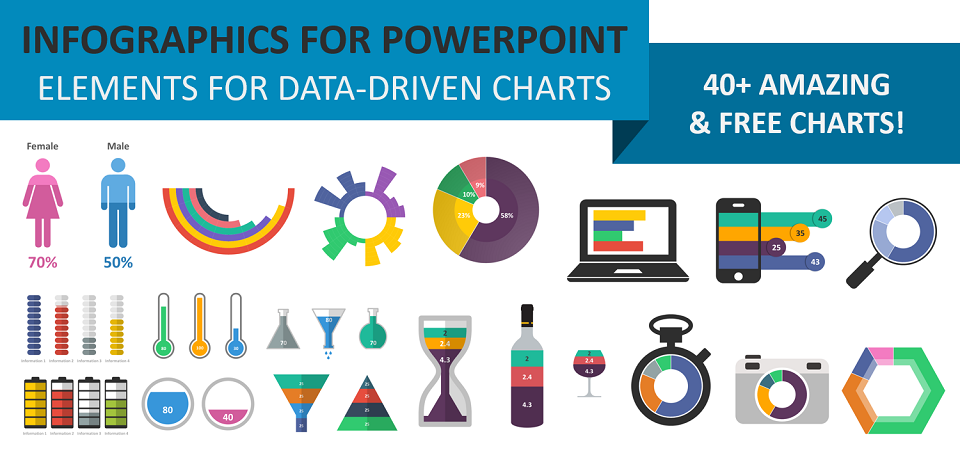
Free charts and infographics PowerPoint templates. Easy and beautiful way to conveying your information in your presentation.
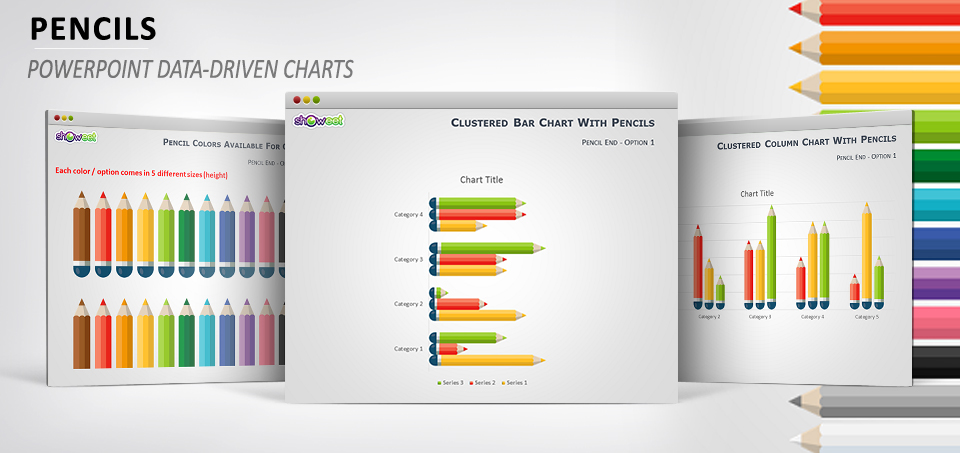
Spice-up your PowerPoint graphs with these free data-driven charts using colored pencil shapes. Great for infographic illustrations.
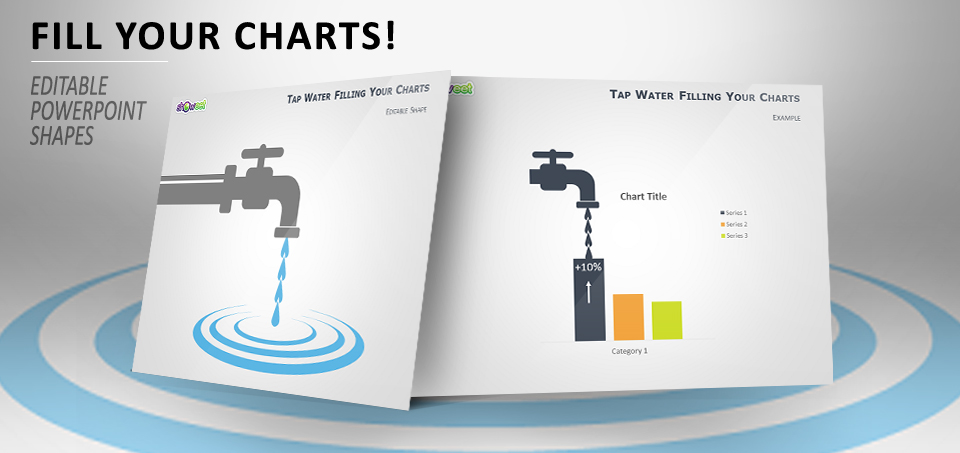
Bring originality to your statistics with this tap water shape flowing and filling your PowerPoint charts.
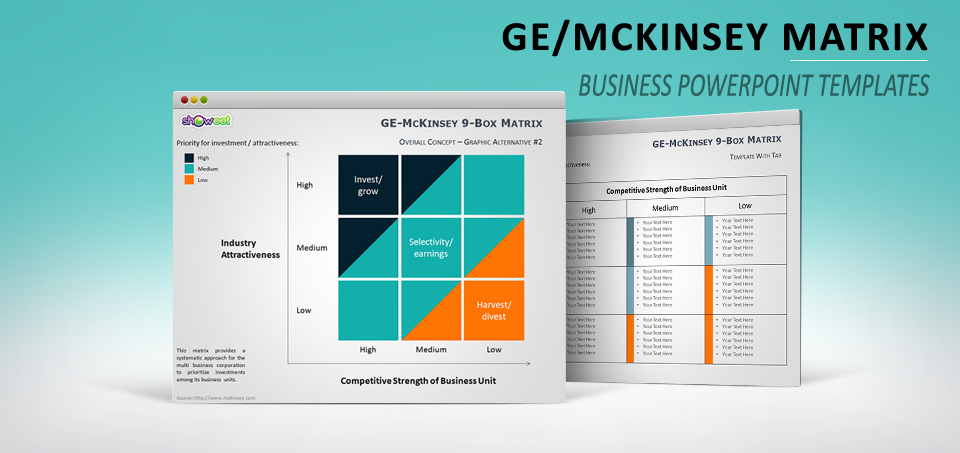
Free GE/McKinsey matrix templates for PowerPoint. Presentation document that contains 8 slides.
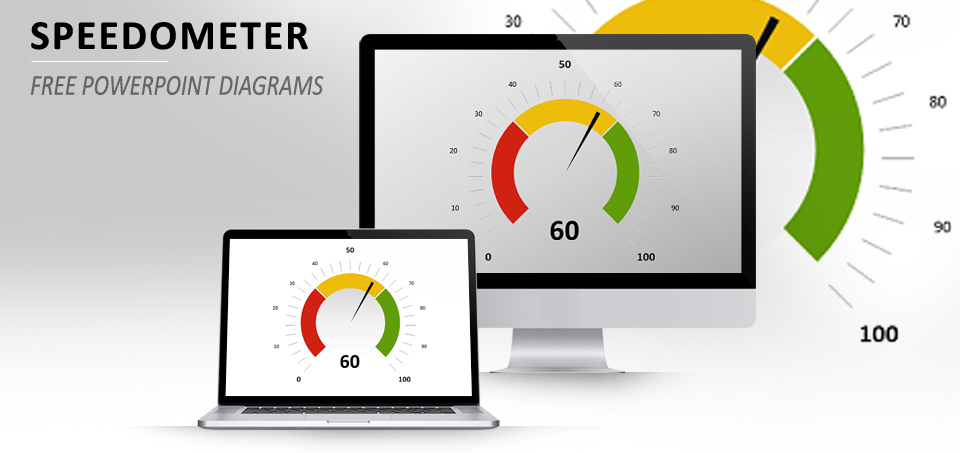
Yet another free data-driven speedometer for PowerPoint. Great to be used for visual presentation of performance measures on a 0-100 scale.