Speedometer 4 – Free Diagram for PowerPoint
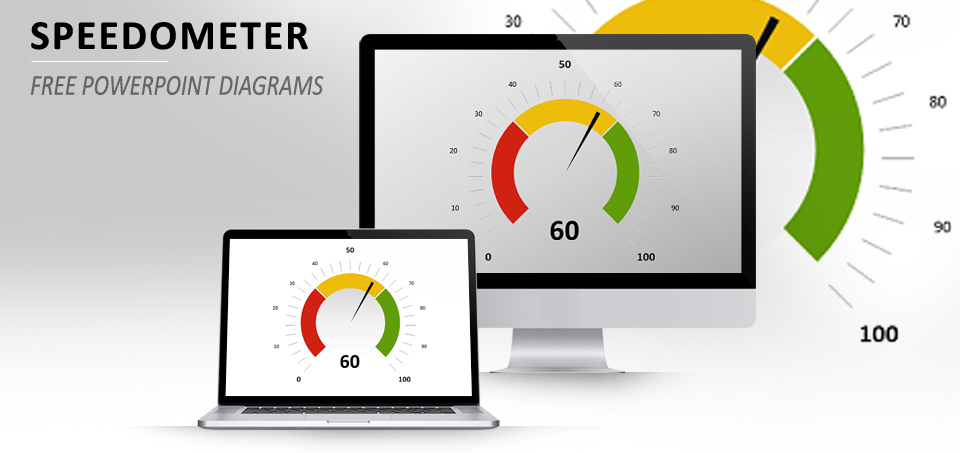
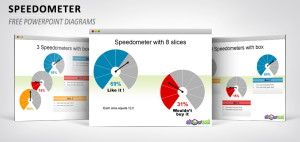
Yet another free data-driven speedometer for PowerPoint. Great to be used for visual presentation of performance measures on a 0-100 scale. Includes 2 slides.
Presentation Package includes:
- 2 slides
- Editable graphics (to easily customize colors and size)
- Feature: can be edited using the built-in diagram function of PowerPoint
- Format available: PowerPoint 2007-2013 (.PPTX)
- Licence: Attribution-NoDerivs 3.0 Unported (CC BY-ND 3.0)
thanks
What is the password to unprotect the file and edit data?
@Grant Welsh : Hi, the zip files are not protected.
Great template! I need to change the range to be 1,000,000 instead of 100. How can I do this?
@ Lindsey: Hi, thank you for using it. Actually you can’t use it strictly using your scale. I suggest that you convert your result on a 0-100 scale (in order to have the arrow positioned correctly – as it uses relative number), and then you change yourself manually the scale on the diagram (the numbers 0, 10, 20, etc. are text boxes, and not built-in the graph). The same way you can manually force your own final result (on a 0-1,000,000 scale) on the box below the graph…
Thank you!!
how do I change the color scale? for example say I want 0 thru 50 to be red and 50 thru 100 to be green
@Mike : You can’t do this very easily: the 3 colors you see are actually 3 different shapes arranged back to the data-driven chart. To get what you need, you’d have to re-design these shapes.