Charts & diagrams
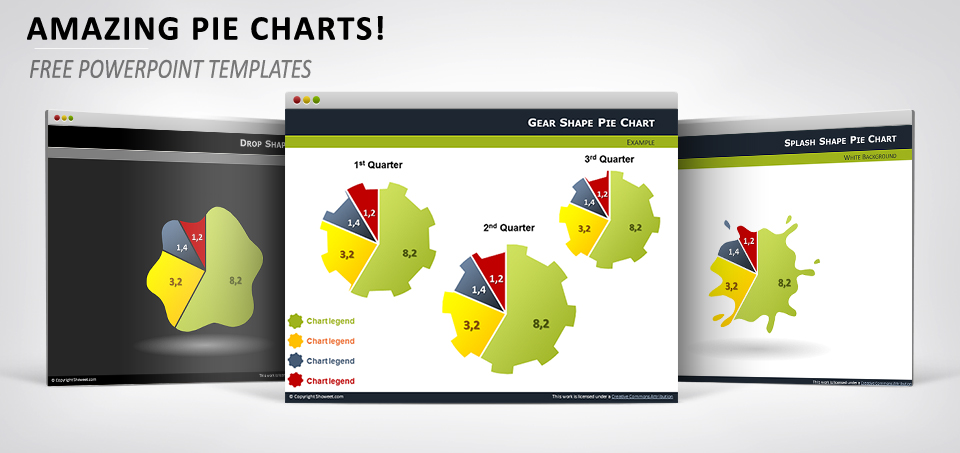
Amazing Pie Charts for PowerPoint
Turn your boring pie charts into surprising and innovative illustrations. These free editable shapes for Powerpoint are to be used with your usual data-driven pie charts.
Free creative templates for PowerPoint and Google Slides
Turn your boring pie charts into surprising and innovative illustrations. These free editable shapes for Powerpoint are to be used with your usual data-driven pie charts.
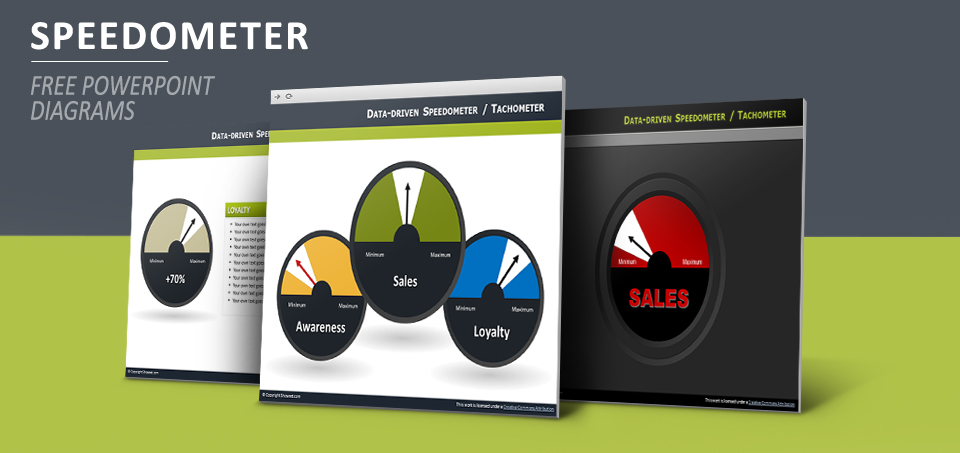
Free data-driven dashboards (also known as speedometers or tachometers) diagrams for PowerPoint.
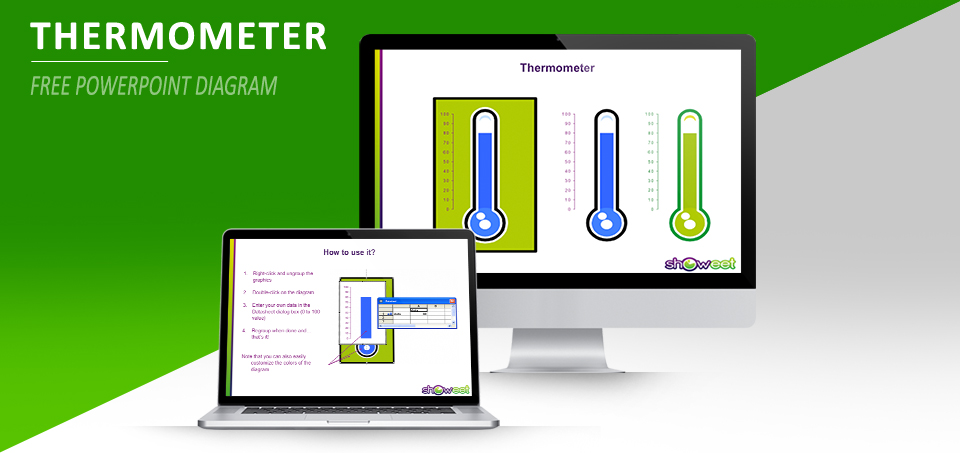
Fully editable data-driven thermometer for PowerPoint built with column chart.