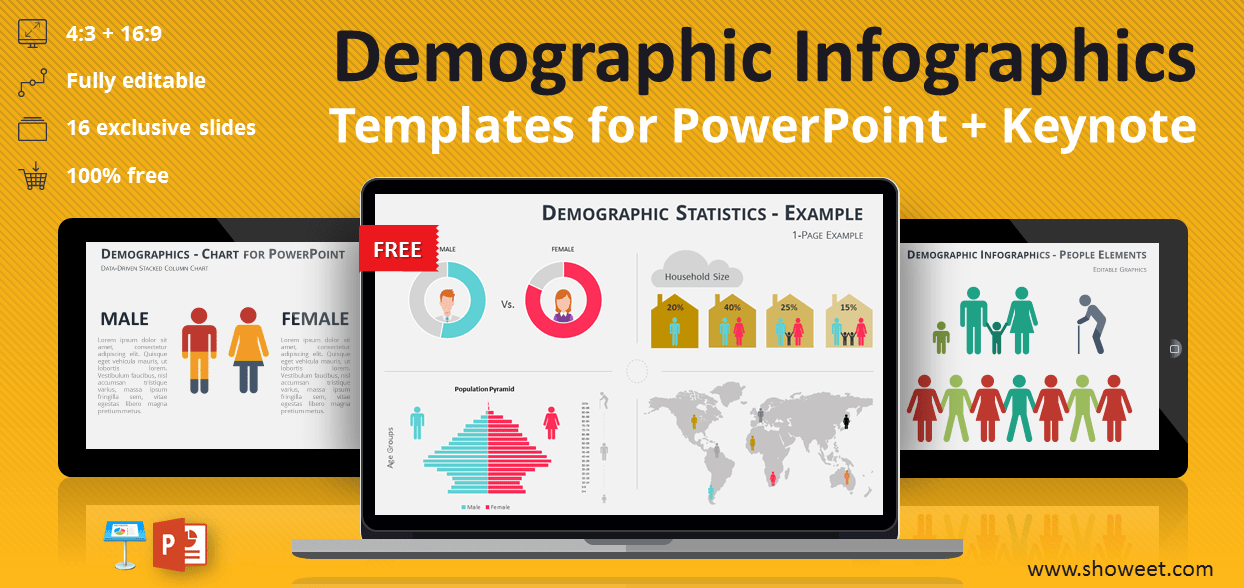
Free collection of demographic infographic elements for PowerPoint and Keynote. Includes 16 ready-to-use editable template slides for your business presentations.
Demographics: the qualities (such as age, gender, and income) of a specific group of people.
Use these graphic elements in your presentations for your data visualization / infographic charts about demographics and statistics, or for your newspapers, brochures, flyer illustrations, etc.
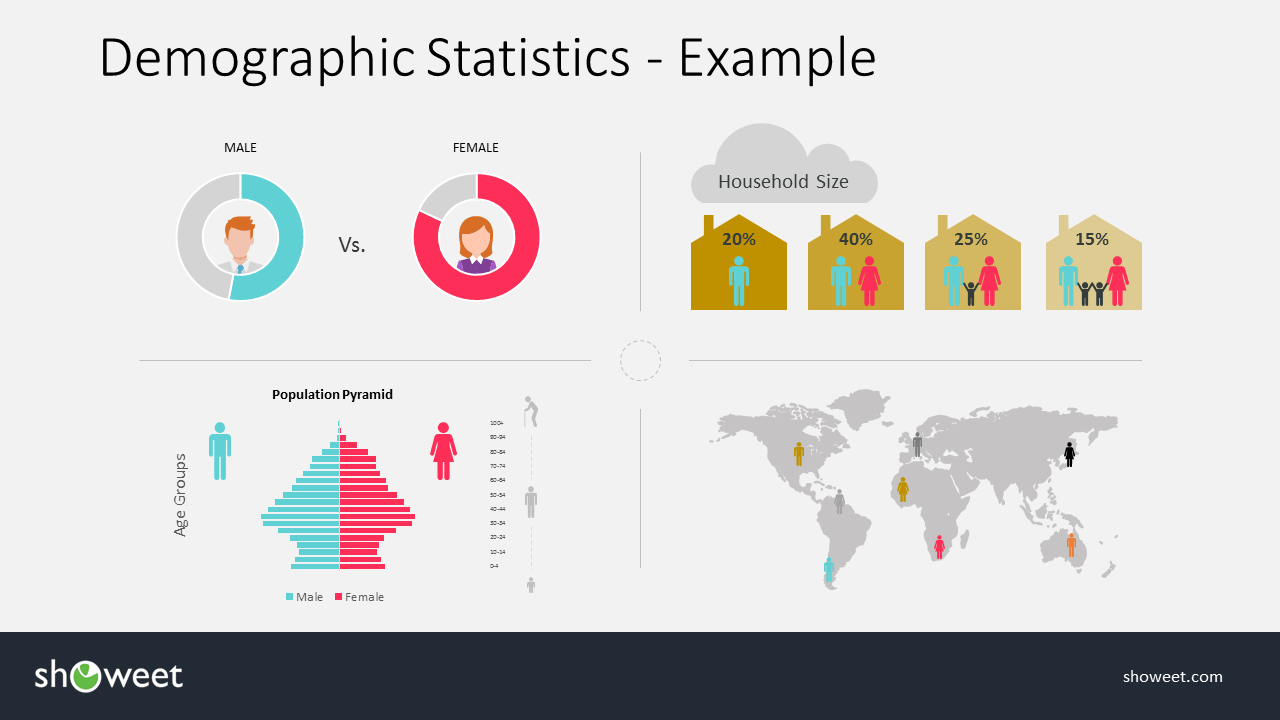
This PowerPoint (.PPTX) + Keynote (.KEY) documents offers 16 free slides containing graphic elements related to demographic information: for e.g. people icons and symbols (male, female, family), population pyramid model, household size slide, gender statistics, data-driven charts, maps of the world (with editable continents or outline)…
2 size layouts available: standard (4:3 screen ratio) and widescreen (16:9).
This free PowerPoint & Keynote document comes with 16 ready-to-use slides
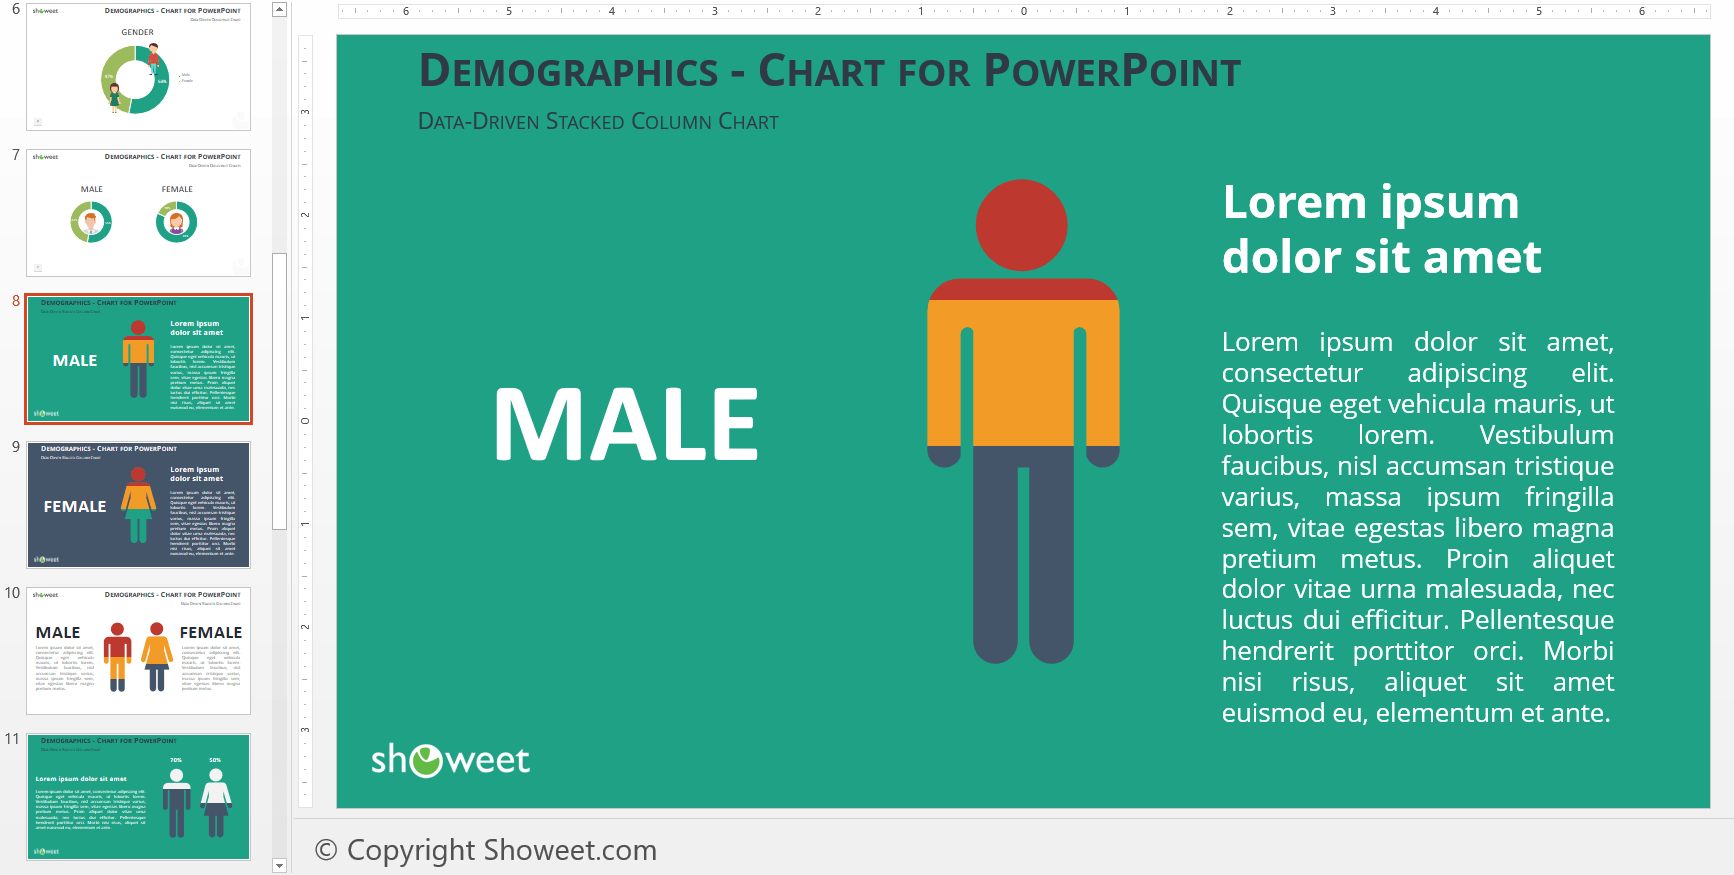
Instructions to use the male / female symbol layouts combined with data-driven charts:
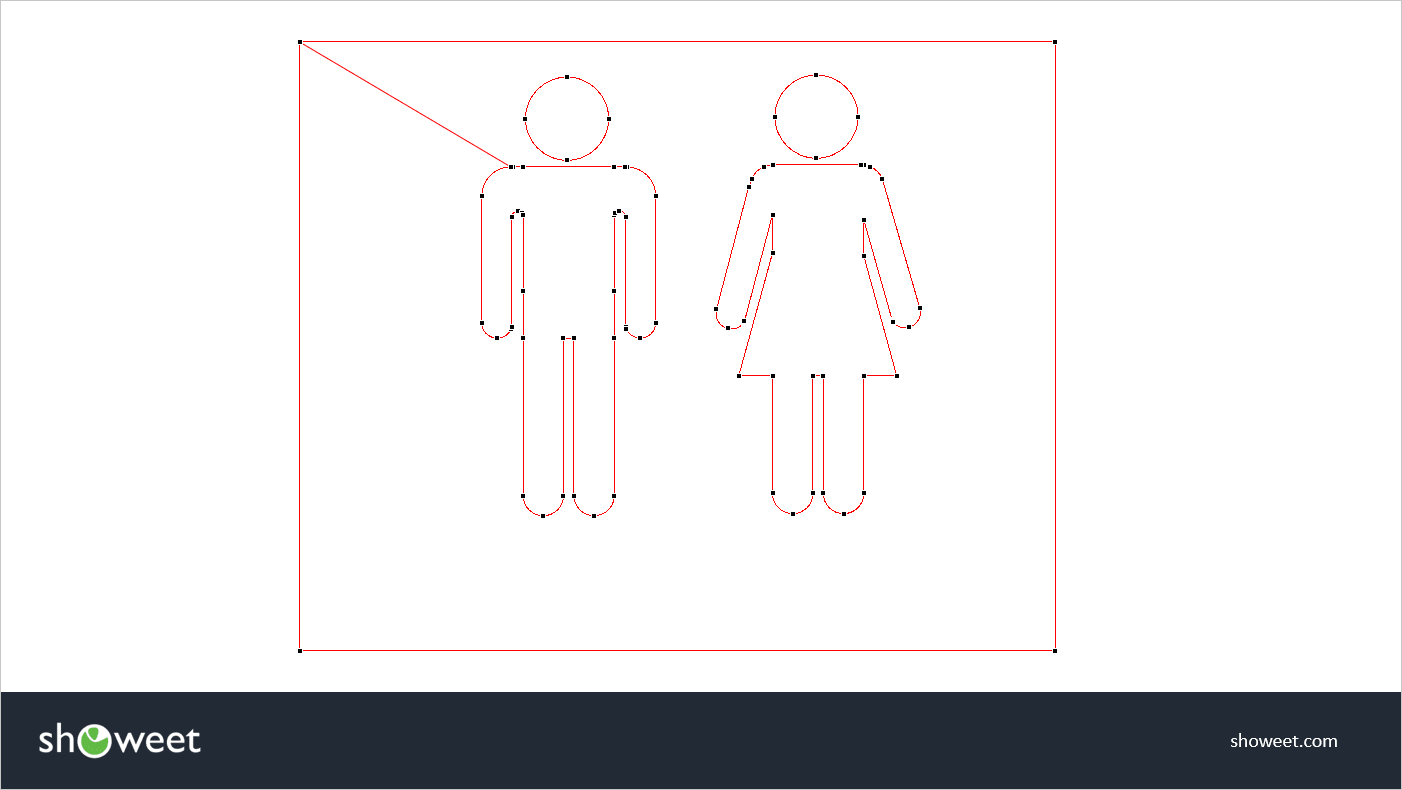
These specific models are made of a shape (see below) and a 100% stacked column chart.
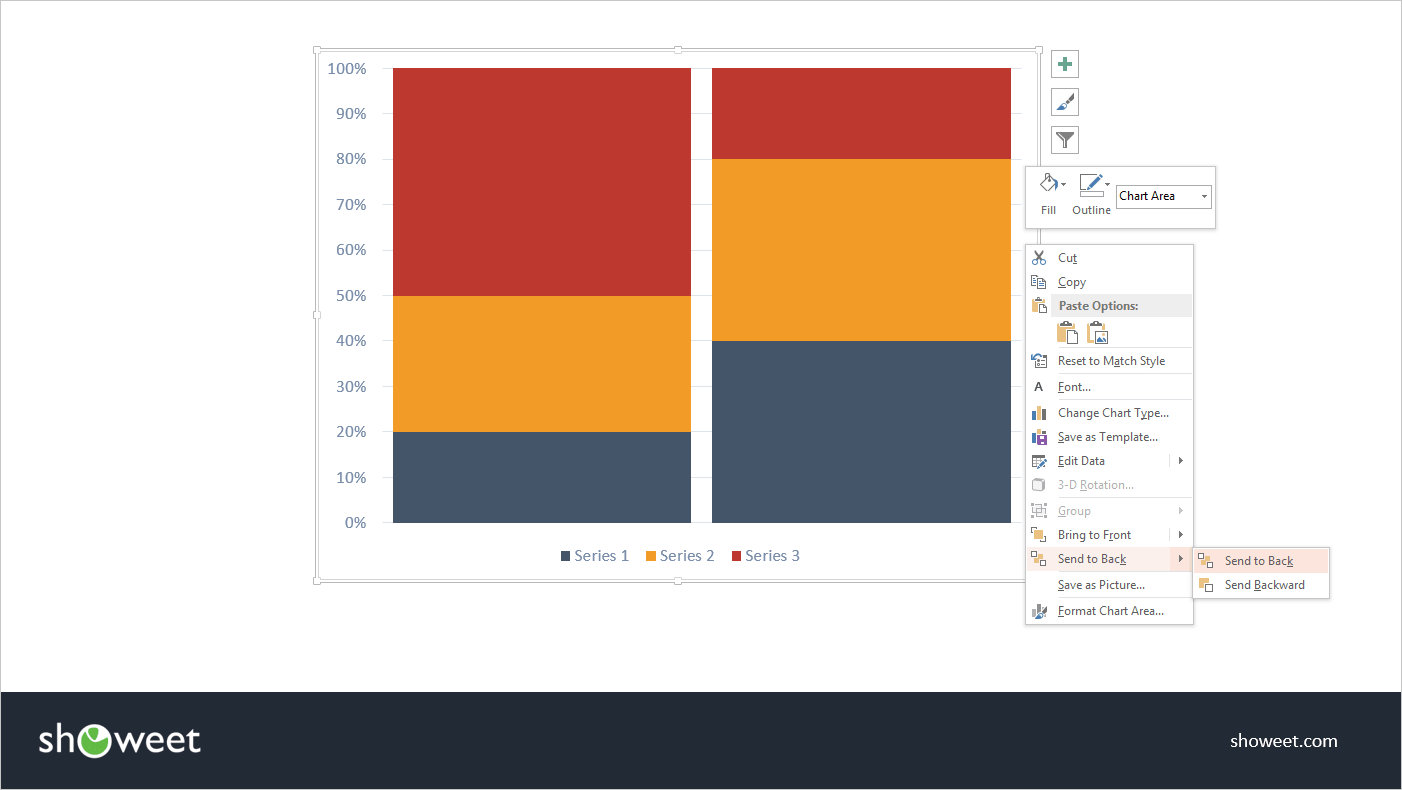
FIRST: select the shape used as a layer and send it back (Arrange >> Send to Back)
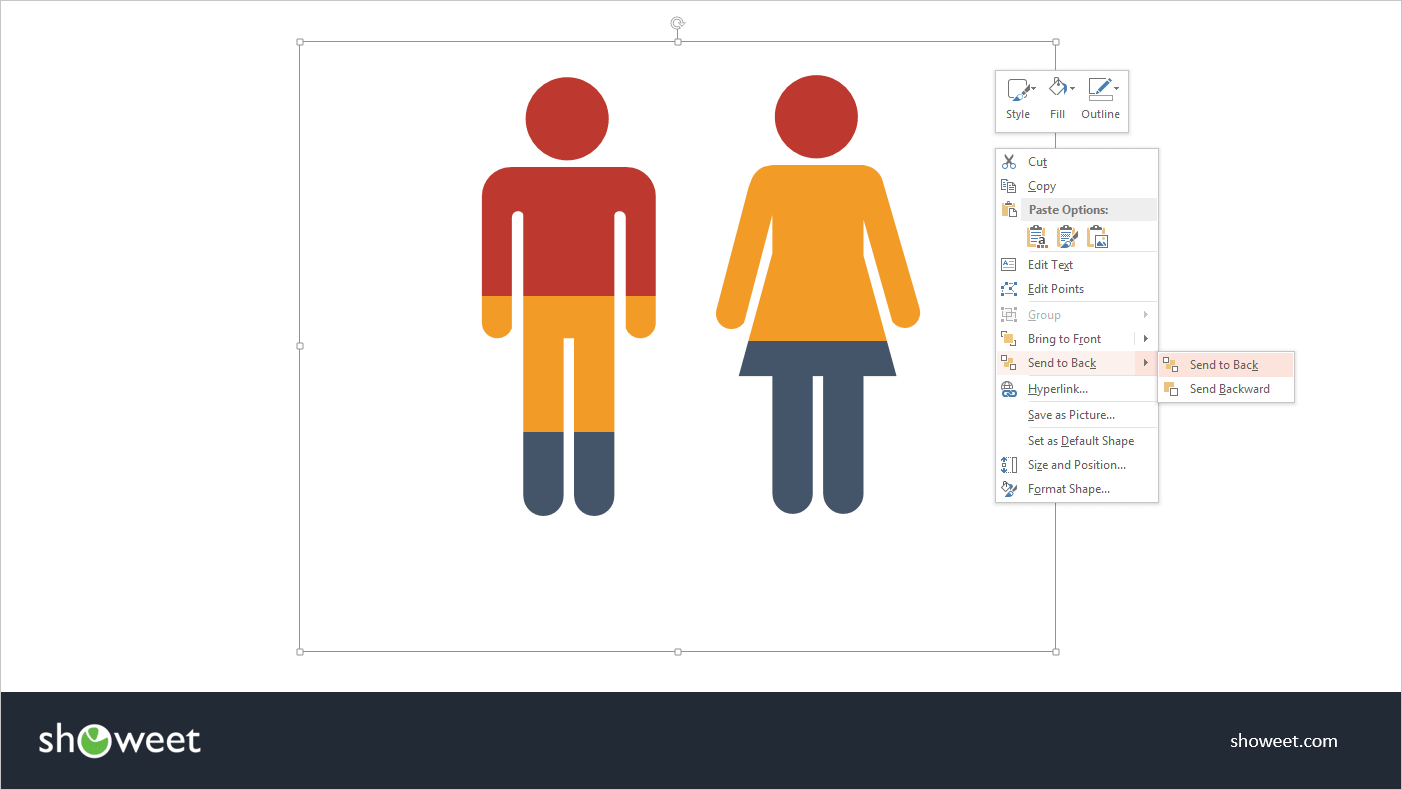
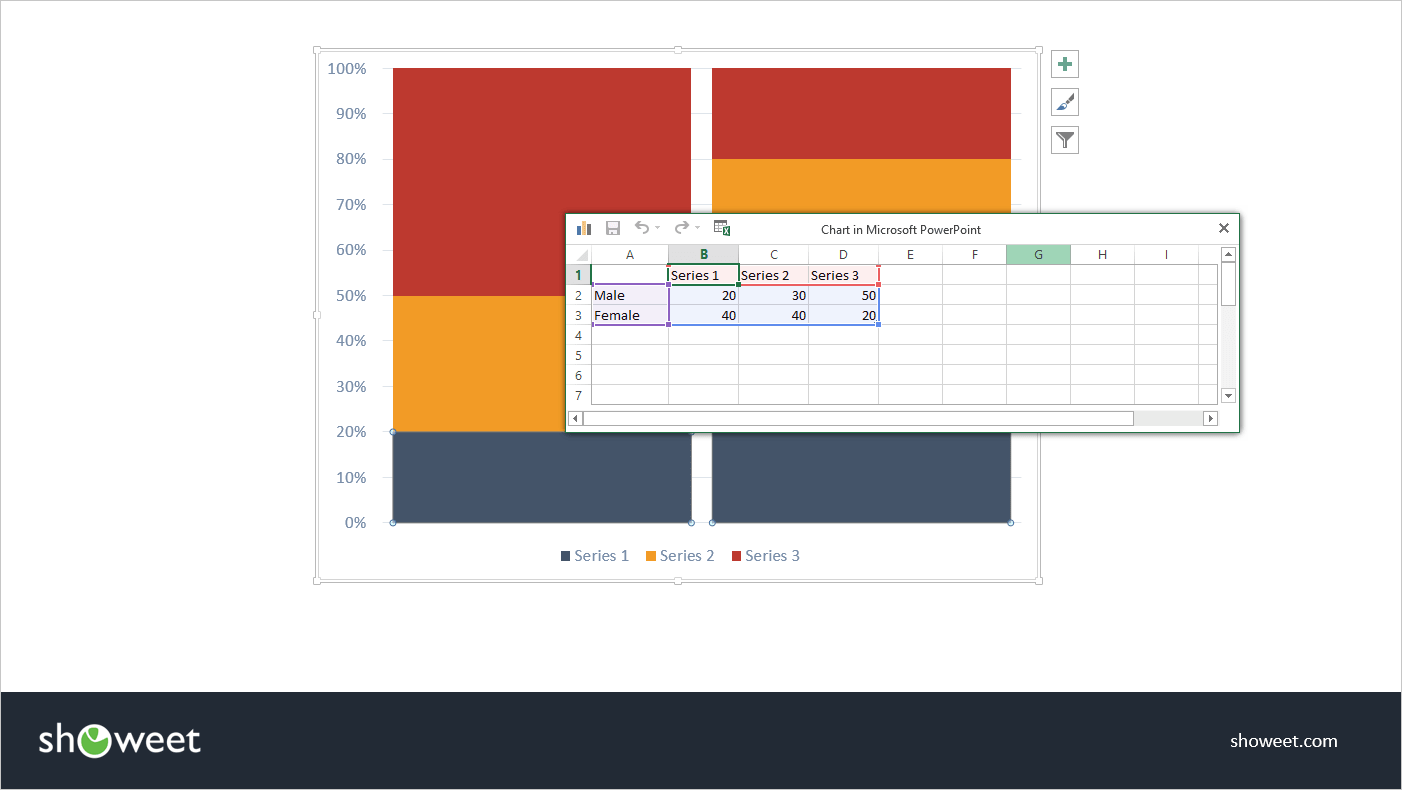
SECOND: select the column chart, edit data
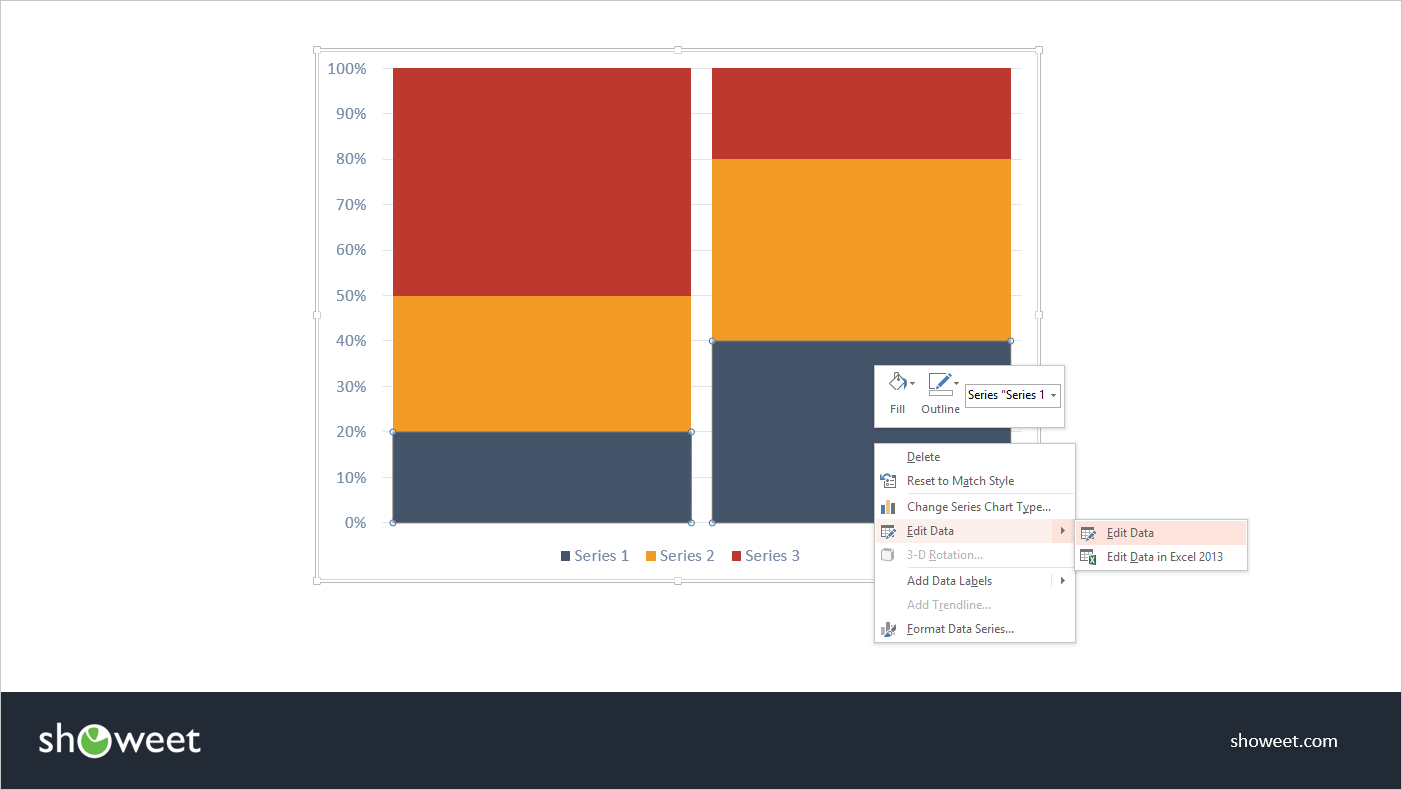
THIRD: in the datasheet, use your own data
FOURTH: now send back the chart, so that the male/female graphic is brought again to the front
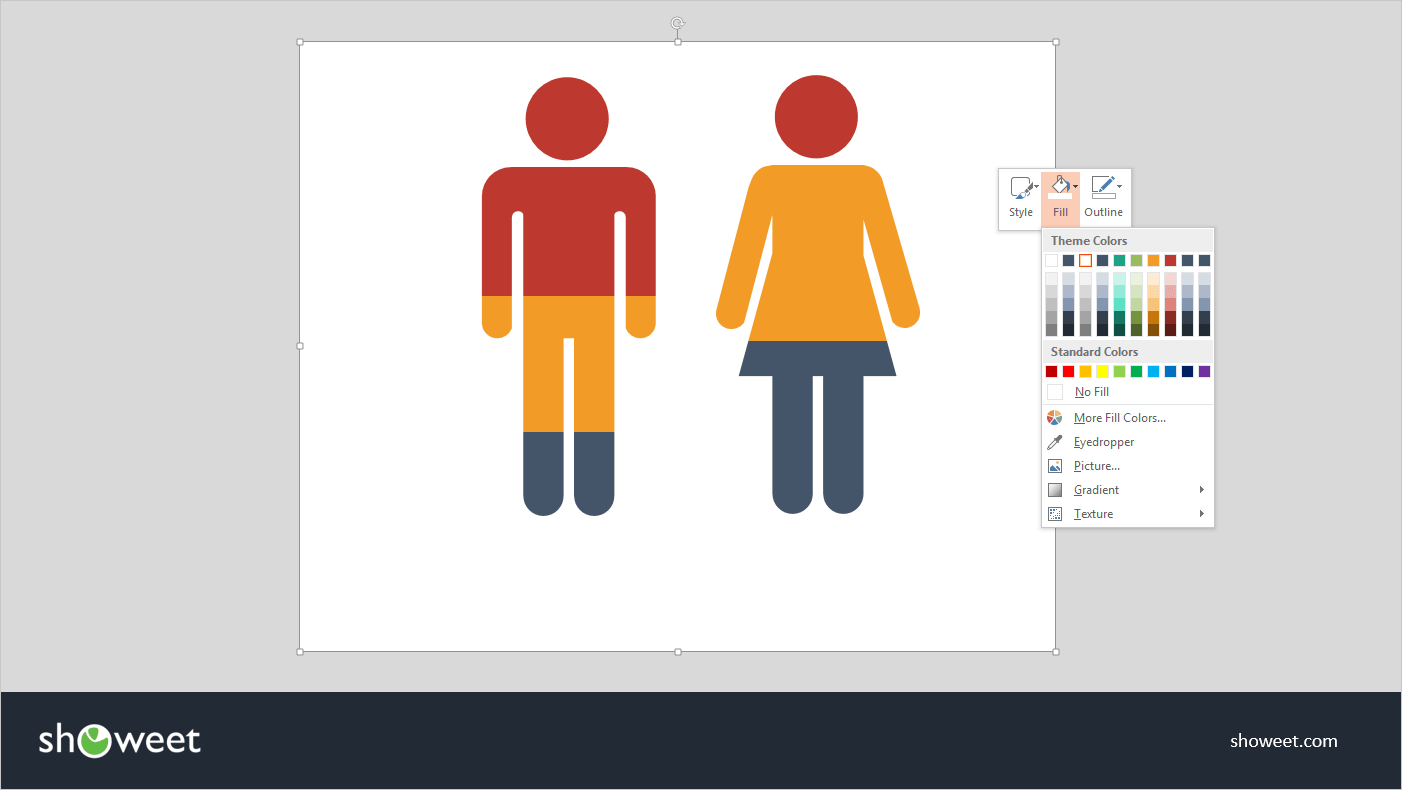
FIFTH: if necessary, adapt the background shape color. It must be the same color as your own template background color
Just pick-up and use the graphics or be more creative, select, adapt and organize them to create your own slide – see this example:
The ‘Demographic Infographics for PowerPoint and Keynote’ document features:
- 16 pre-designed unique, clean and professional slides
- Fully editable content: graphics and text
- All objects are 100% vector. Easy to customize style (e.g., fills, outline, effects and scale) without quality loss
- Modern, attractive and professional colors
- Aspect ratios: Standard (4:3), Widescreen (16:9)
- FREE fonts used: Calibri (System font), FontAwesome (for the icons)
- Formats: PowerPoint (.PPTX) and Keynote (.KEY)
- License: Free – Attribution (please read carefully the ‘Terms of Use‘ before using this template, restrictions may apply)
Slides included:
Slide size: standard (4:3)
")


Slide size: widescreen (16:9)
")


Google Slides preview:
(To use this template with Google Slides, first download the .PPTX theme on your desktop, and then import it in Google Slides – read tutorial)
Comments are closed.