Charts & diagrams
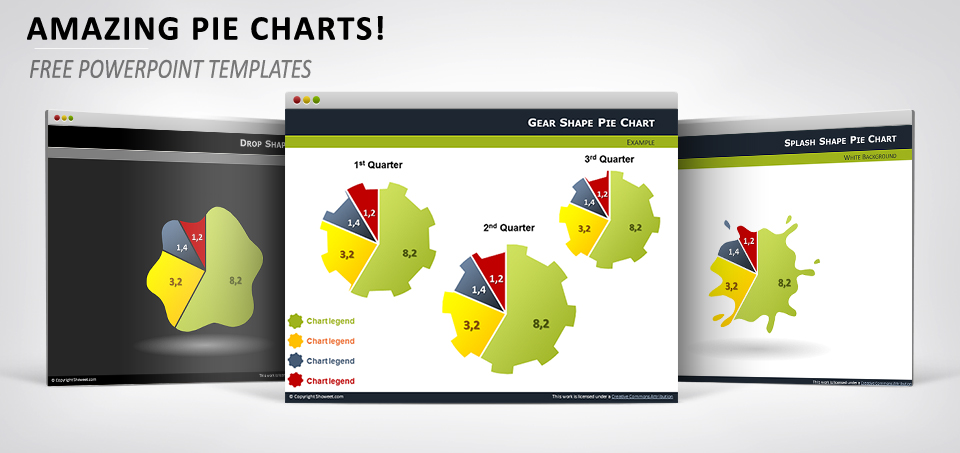
Amazing Pie Charts for PowerPoint
Turn your boring pie charts into surprising and innovative illustrations. These free editable shapes for Powerpoint are to be used with your usual data-driven pie charts.
Free creative templates for PowerPoint and Google Slides
Turn your boring pie charts into surprising and innovative illustrations. These free editable shapes for Powerpoint are to be used with your usual data-driven pie charts.
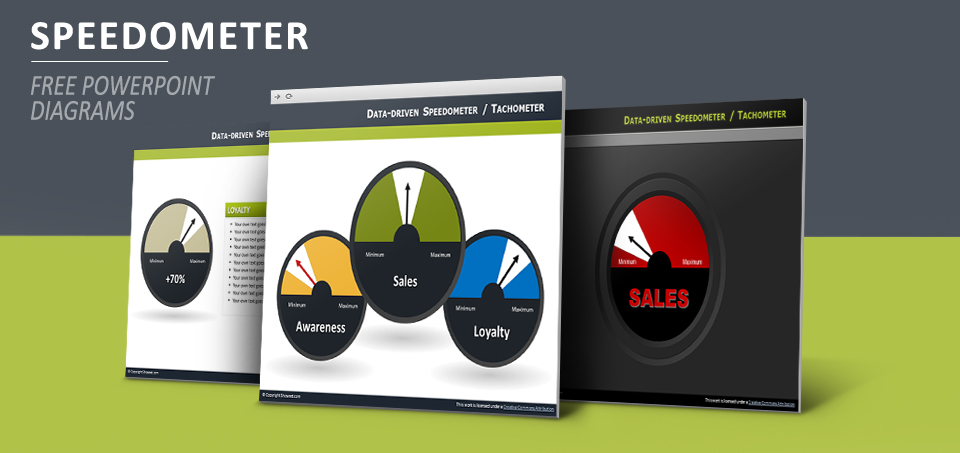
Free data-driven dashboards (also known as speedometers or tachometers) diagrams for PowerPoint.
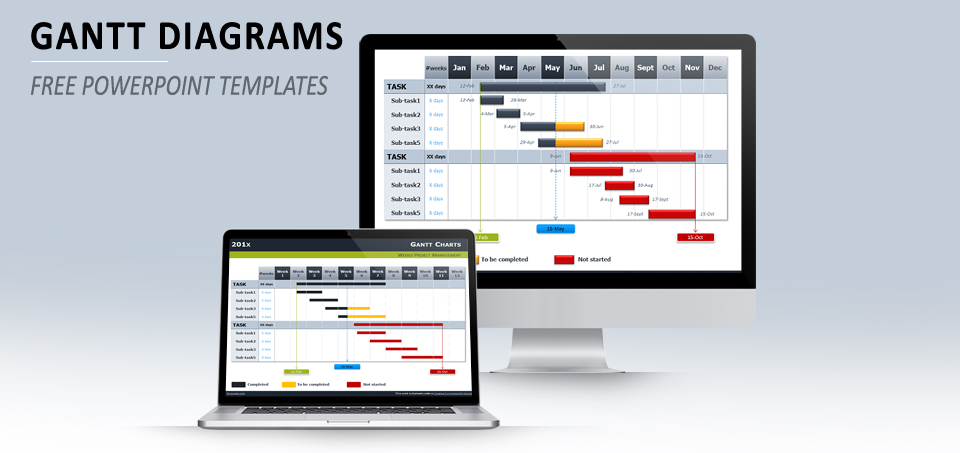
Free Gantt chart (also called Gantt diagram) template for PowerPoint. Includes 4 high pre-designed quality slides with editable (i.e. easily customizable) graphics, along with tutorial. An essential project management tool used for scheduling projects, events or personal milestones or goals.
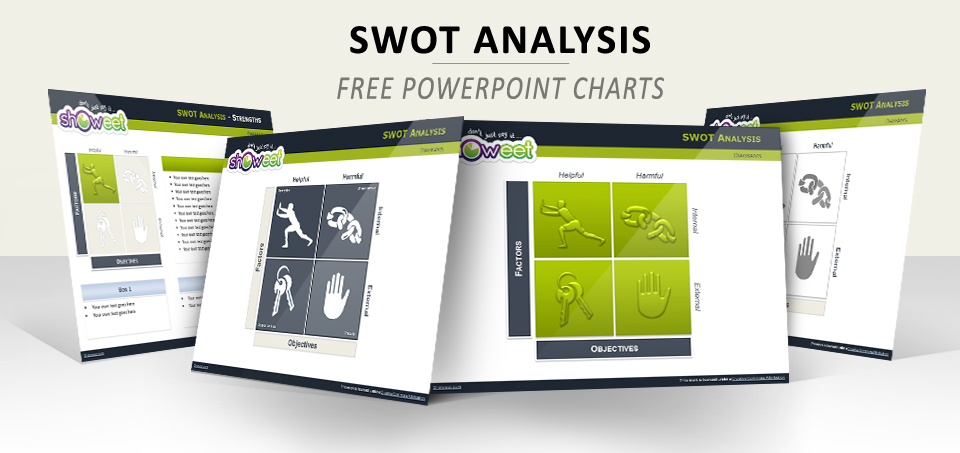
Where am I? In business analysis, it is key to know and understand how your company fits in and interacts with the surrounding environment on both an internal and external view.
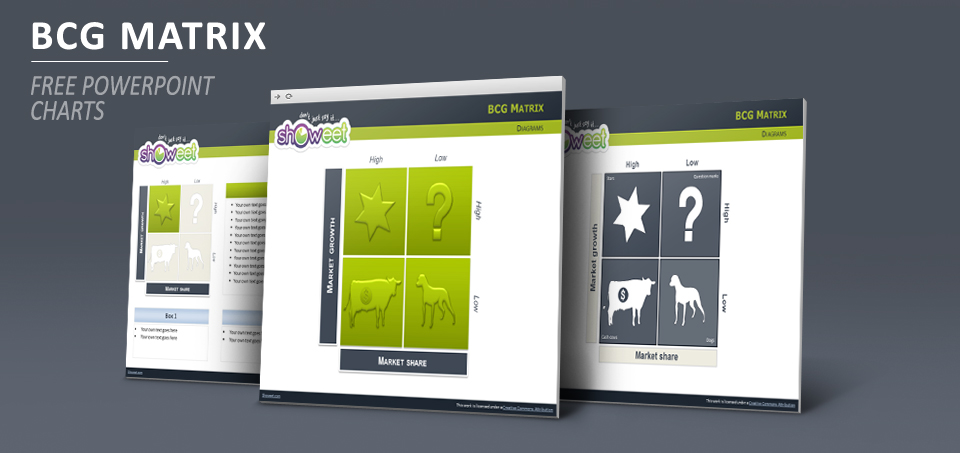
Free professional BCG Matrix Charts for PowerPoint. Includes 14 high quality slides with editable (i.e. easily customizable) graphics.
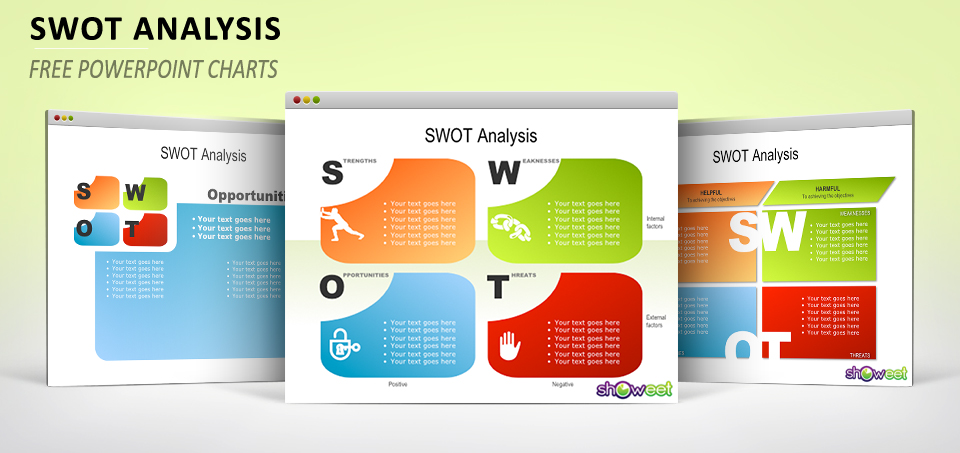
SWOT analysis free Powerpoint charts. Includes 10 high quality slides with editable graphics.
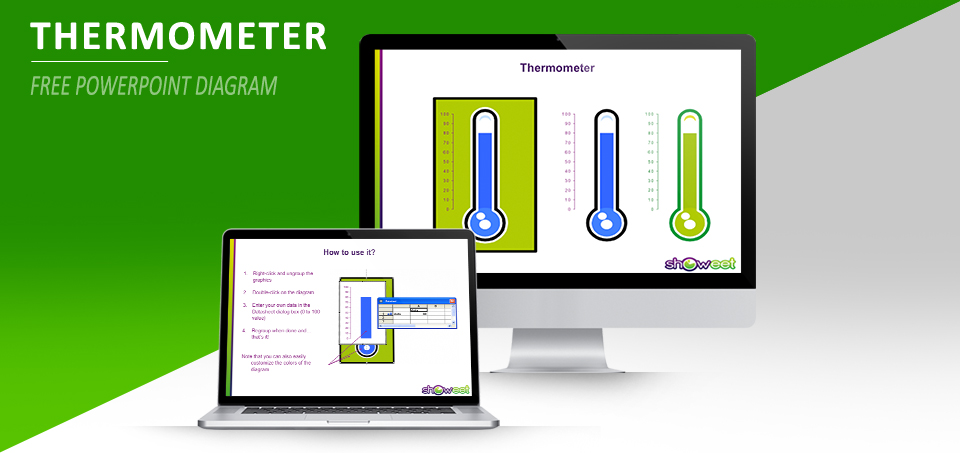
Fully editable data-driven thermometer for PowerPoint built with column chart.