Charts & diagrams
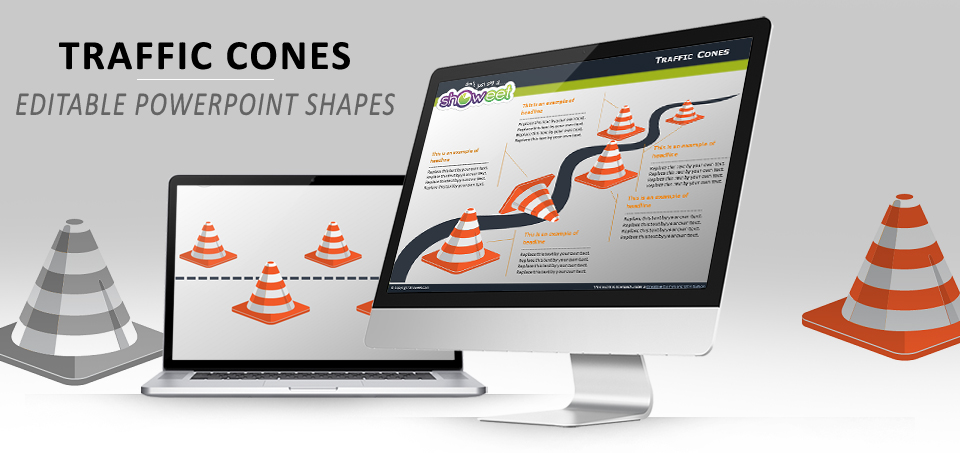
Traffic Cones Diagrams for PowerPoint
Free traffic cones zig zag path diagrams for PowerPoint. Fully editable shapes. Contains 5 slides.
Free creative templates for PowerPoint and Google Slides
Free traffic cones zig zag path diagrams for PowerPoint. Fully editable shapes. Contains 5 slides.
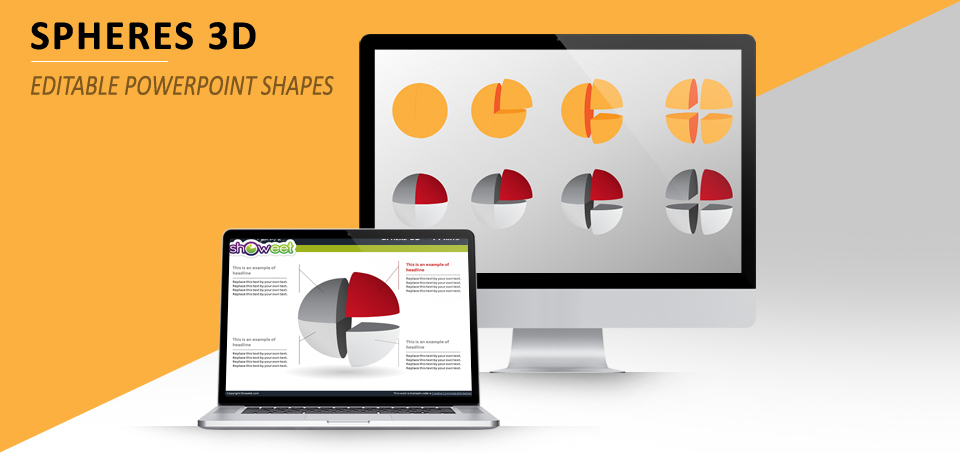
Free editable spheres 3D diagram shapes for PowerPoint. With 4 parts / slices that can be separated. A creative way to make your matrix more visual.
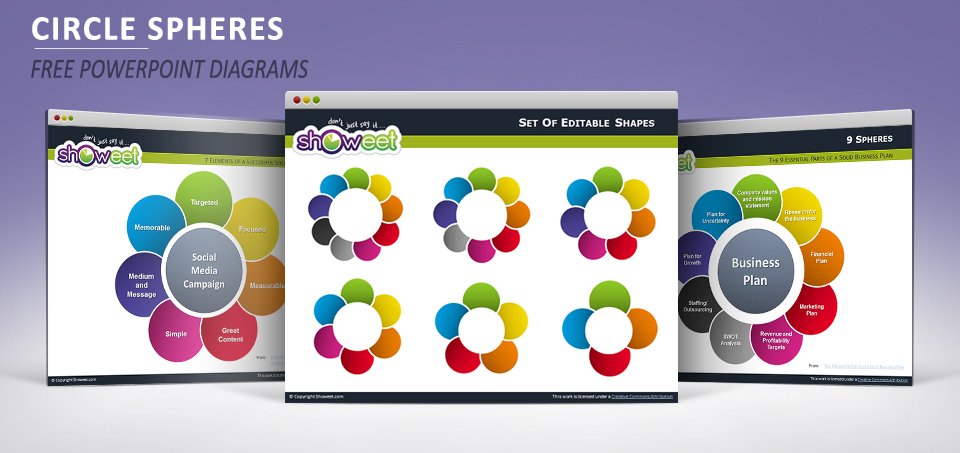
Free circle spheres for PowerPoint. Pre-designed diagrams made of 9 to 4 fully editable shapes. Also known as radial diagrams or even Venn diagrams, the use of these overlapping spheres is great to illustrate a Process Cycle, or the main elements of a strategic model.
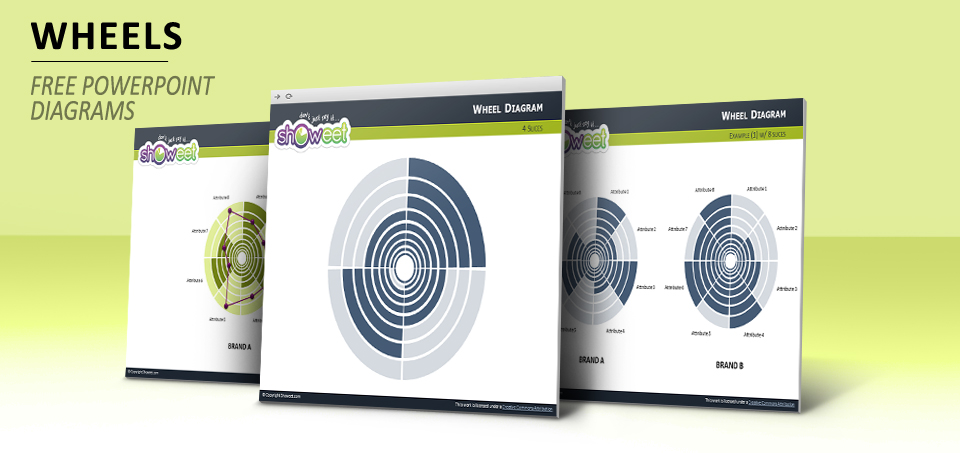
Free wheel diagrams (also known as spider, radar or radial charts) for PowerPoint.
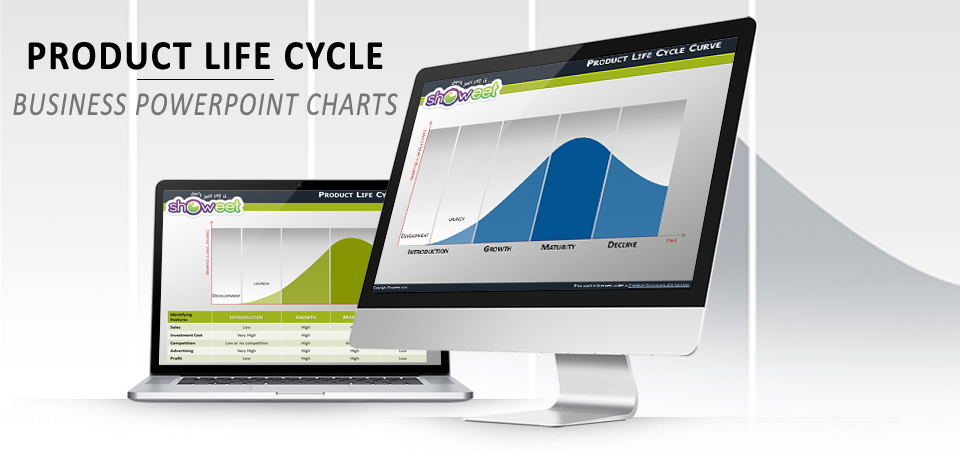
Free editable Product Life Cycle diagrams for PowerPoint. Includes 6 high pre-designed quality slides with fully editable (i.e. easily customizable) graphics.

Yet another free data-driven speedometer for PowerPoint. Great to be used for visual presentation of performance measures on a 0-100 scale.
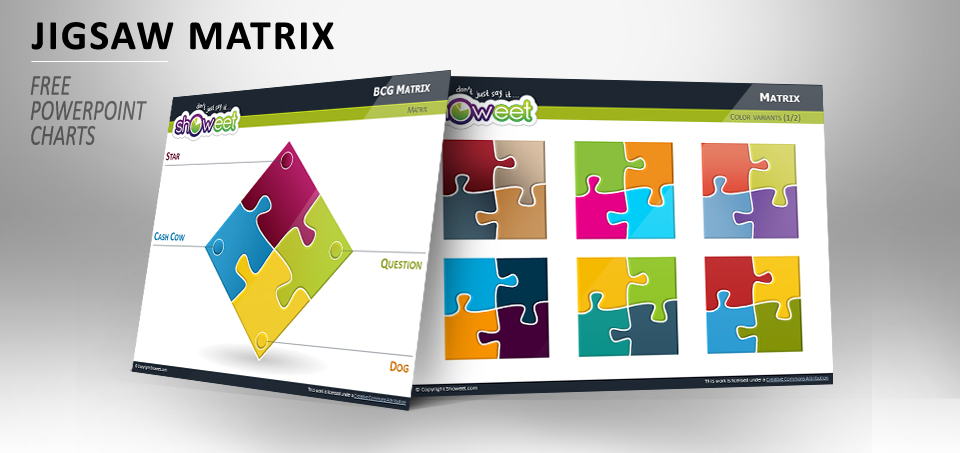
Showeet’s back with this free 2×2 matrices with jigsaw puzzle pieces for PowerPoint. Fully editable shapes. With examples for SWOT Analysis, BCG or 4-P marketing mix matrix. Also released with different color-schemes.
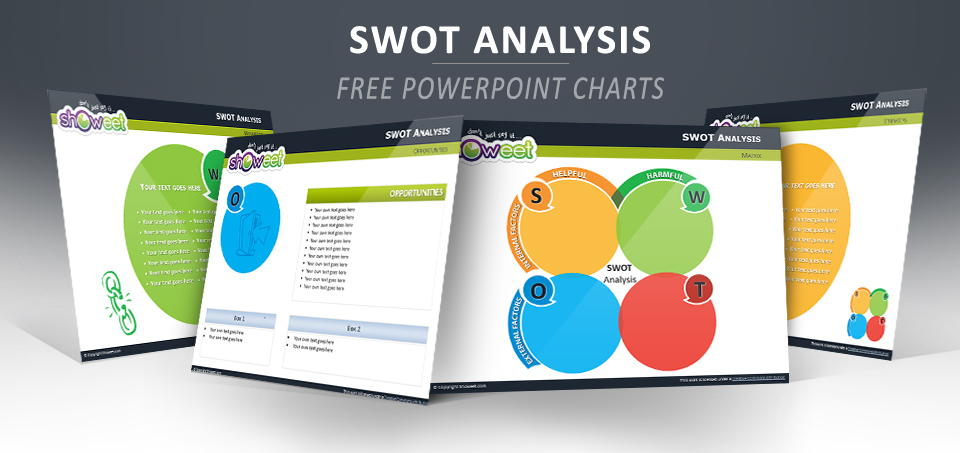
Third variant of free SWOT analysis template for PowerPoint. Creative design with round shapes for the four quadrants of the matrix.