Free professional BCG Matrix Charts for PowerPoint. Includes 14 high quality slides with editable (easily customizable) graphics.
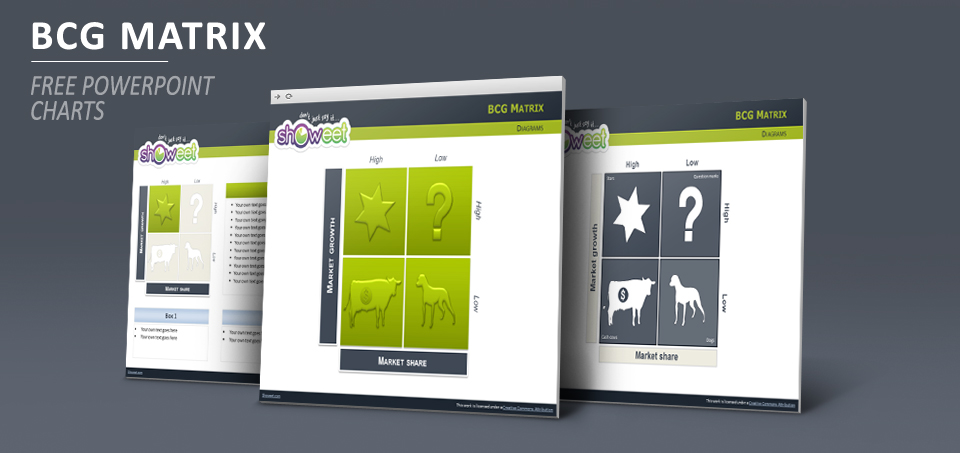
The BCG Matrix is very widely used marketing technique to illustrate how a portfolio of products should be diversified and well-balanced.
The matrix chart, a scatter plot graph is used to rank the business units (or products) on the basis of their relative market shares and growth rates and positive or negative cash flow. This framework categorizes products within a company’s portfolio as stars, cash cows, dogs, or question marks.
- Stars: high market share and high growth products
- Cash cows: high market share and slow growth
- Question marks: low market share, high growth products
- Dogs (or pets): low market share and slow growth
Presentation Package includes:
- 14 slides
- Editable graphics (to easily customize colors and size)
- Placeholder text for your own text and descriptions.
- Format(s) available: optimized for PowerPoint 2007-2013 (.PPTX)
- Licence: Attribution-NoDerivs 3.0 Unported (CC BY-ND 3.0)
Slides included:


Comments are closed.