
Stunning collection of infographic radial charts for your PowerPoint presentations. Professional design. Ready and easy-to-use.
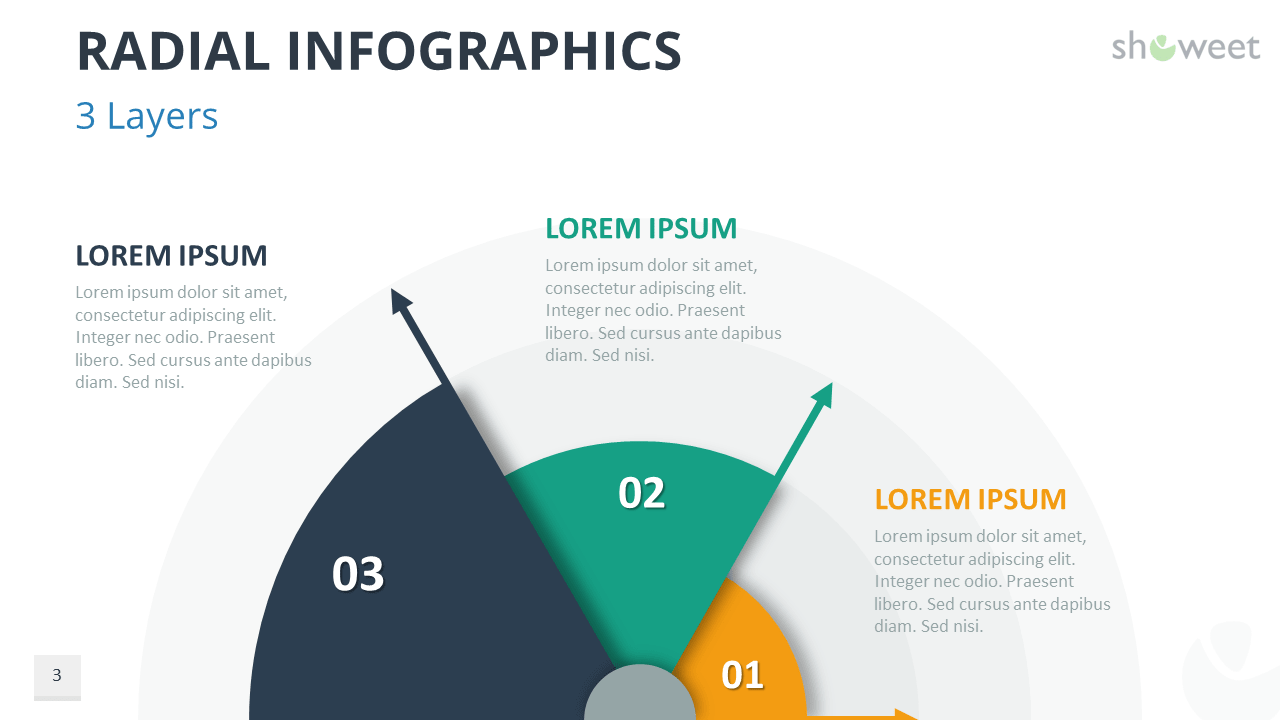
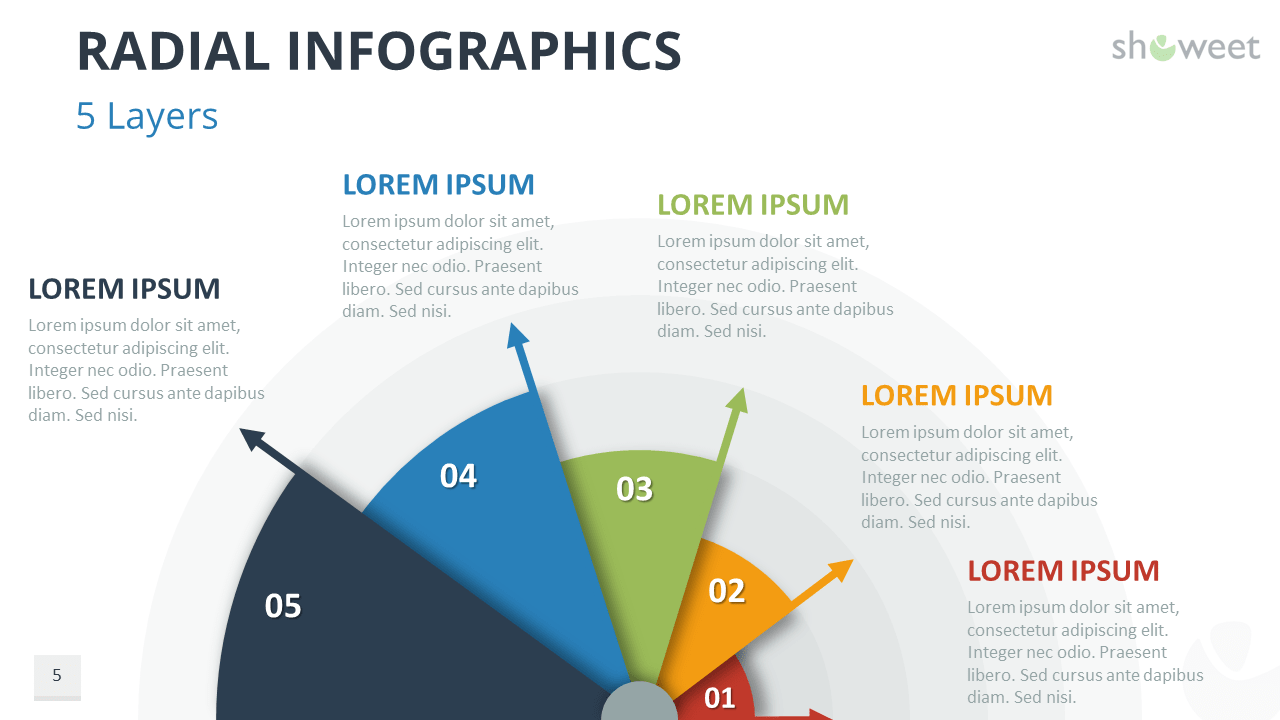
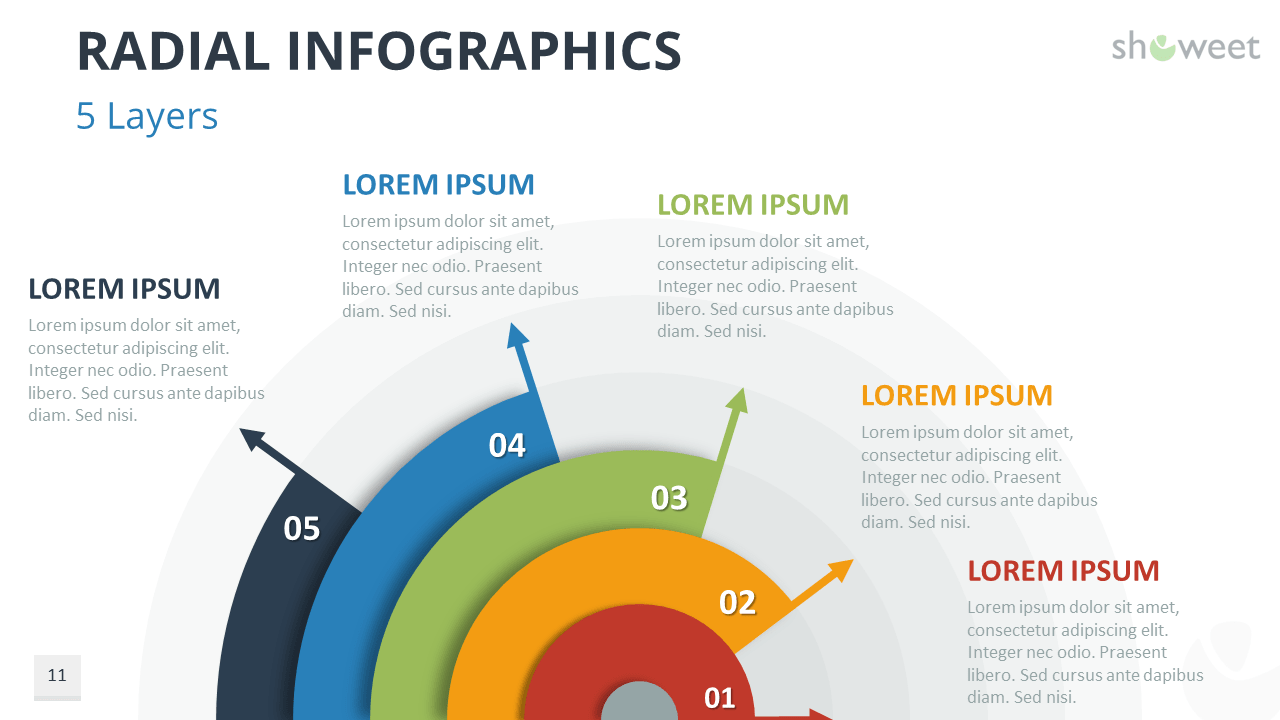
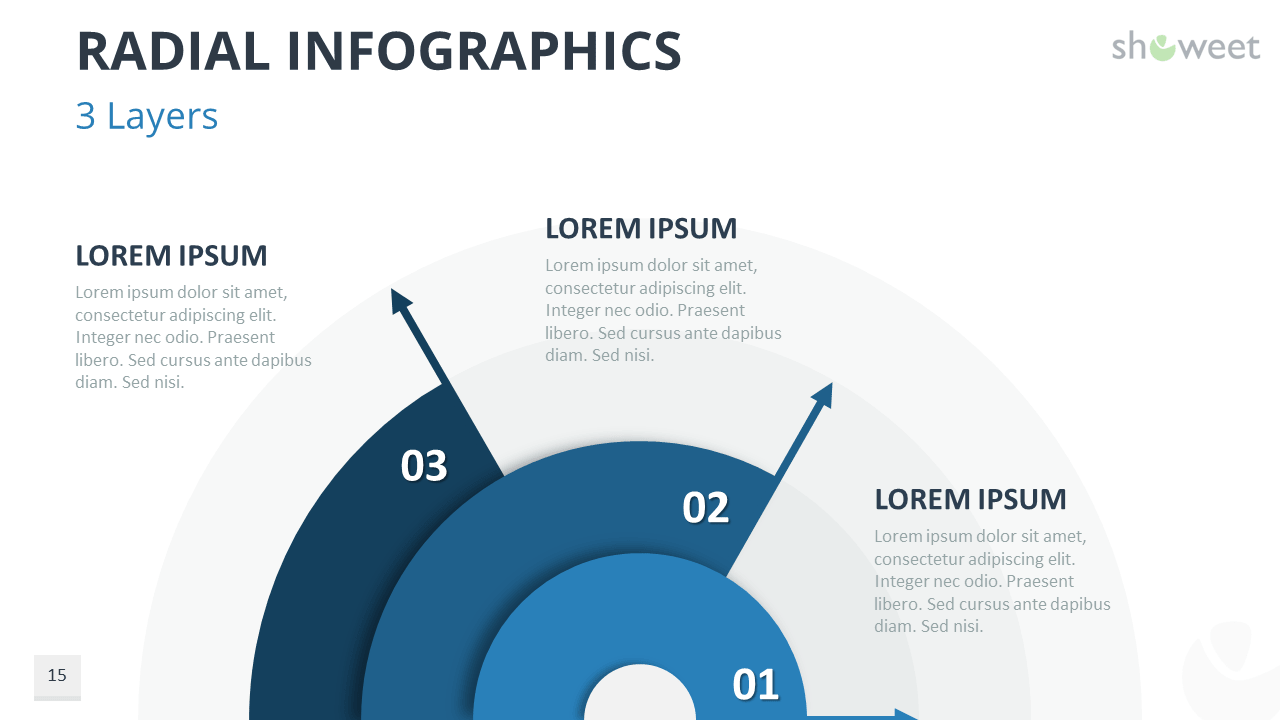
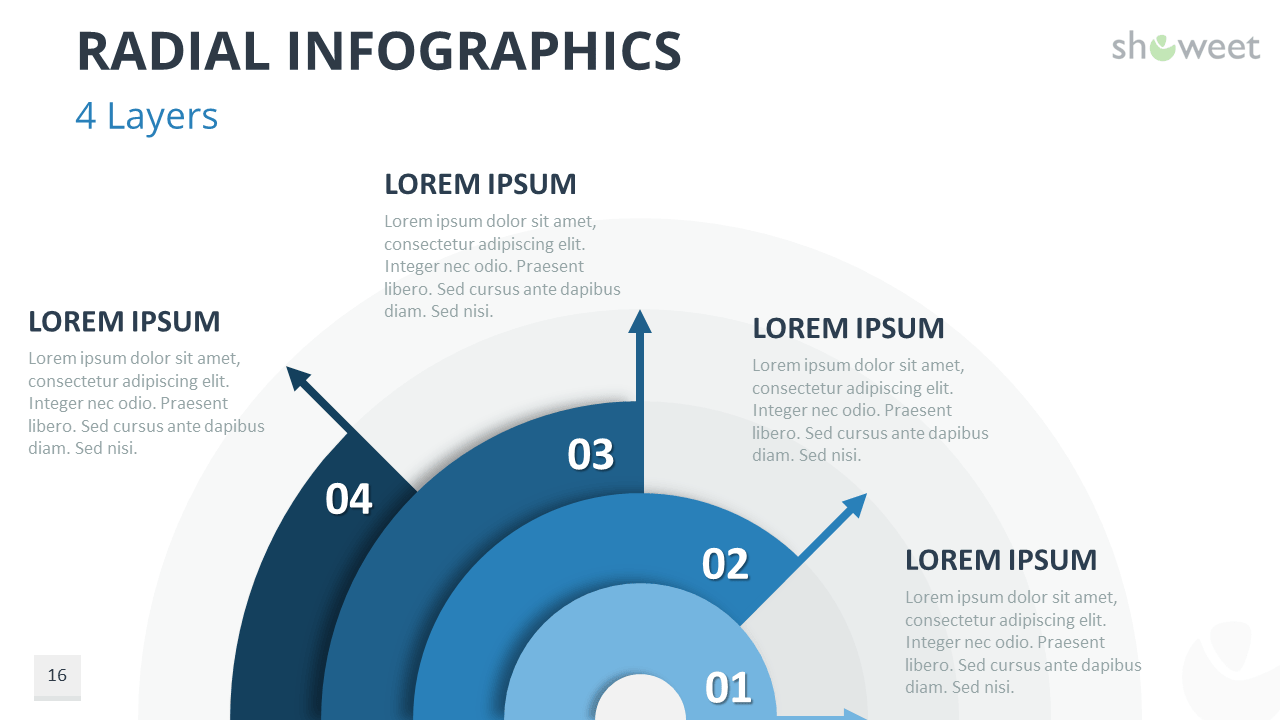
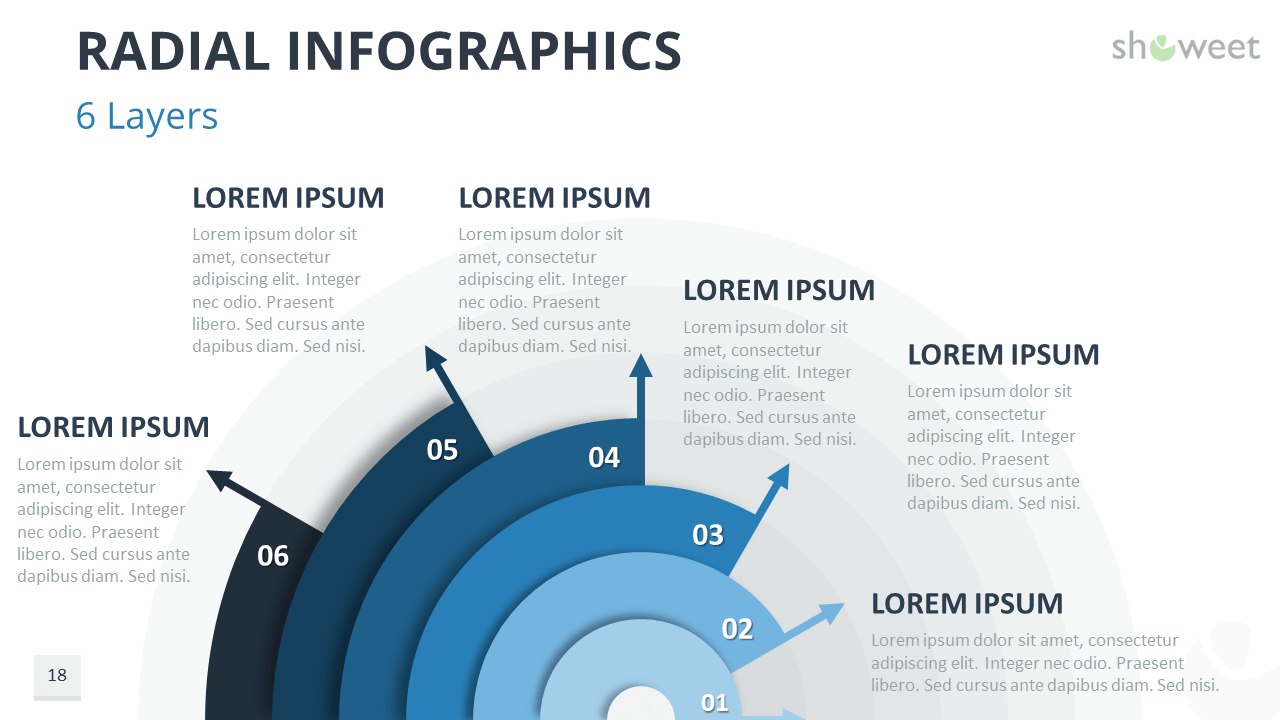
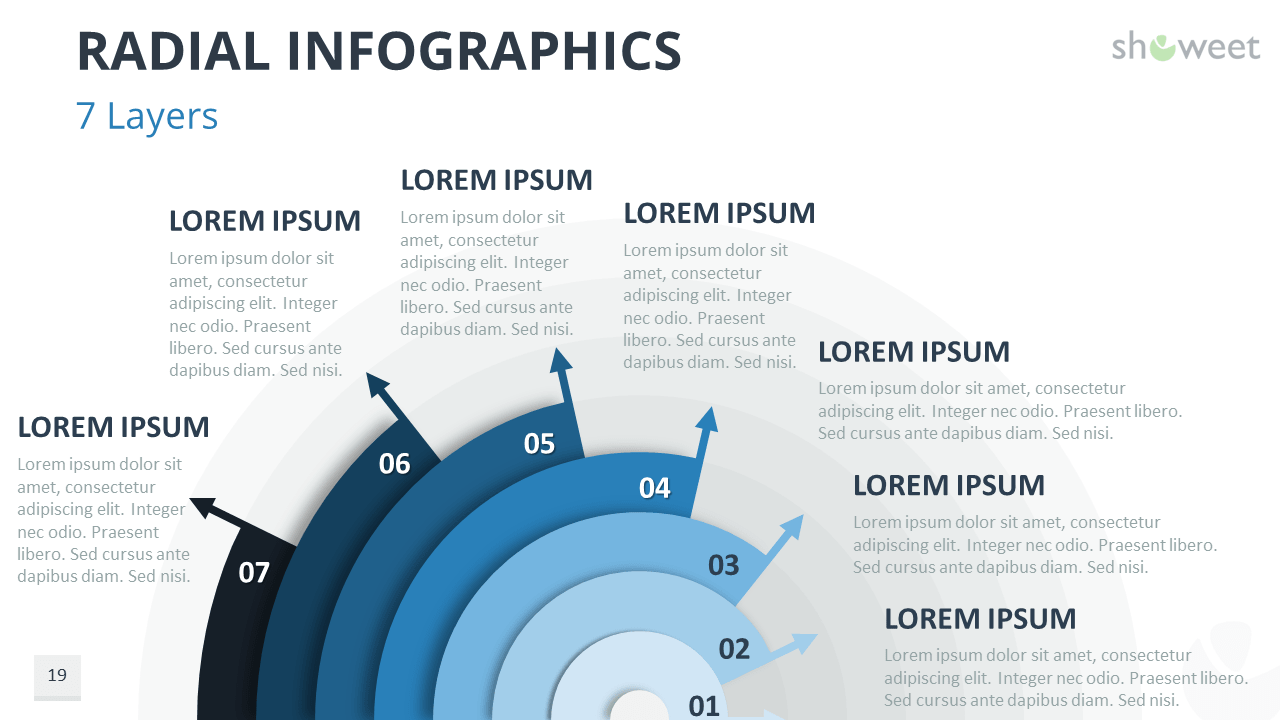
These semi-circle (not data-driven) radial/circular bar charts are usually used to show comparisons among categories.
In fact, these concentric donut look-alike charts are multipurpose! You can use them in your presentations to show any slide with blocks of information: (numbered) lists, table of contents, a process, a timeline… you name it.
This selection of 15 custom-made amazing infographic charts with completely editable creative graphics and text placeholders will undoubtedly give the “wow” factor to your presentation.
3 design options are offered, and 5-layer levels for each (i.e., from 3 to 7 layers).
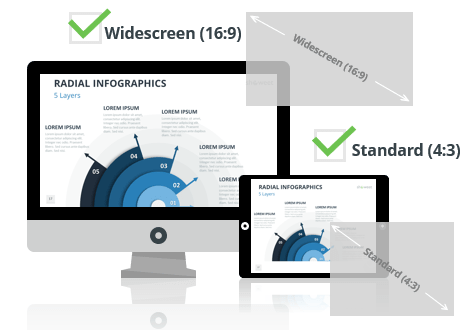
2 size layouts are available for your convenience: standard (4:3 screen ratio) and widescreen (16:9).
The document ‘Radial Infographics for PowerPoint’ features:
- 15 pre-designed unique, clean and professional slides
- Fully editable content (graphics and text) via PowerPoint – No Photoshop needed!
- Aspect ratios: Standard (4:3), Widescreen (16:9)
- Format: PowerPoint (.PPTX) – created with PowerPoint 2016
- License: Free – Attribution (please read carefully the ‘Terms of Use‘ before using this template, restrictions may apply)
Free font used:
- Calibri (System font)
Slides included:


Comments are closed.