Charts & diagrams
Flower Diagrams For PowerPoint
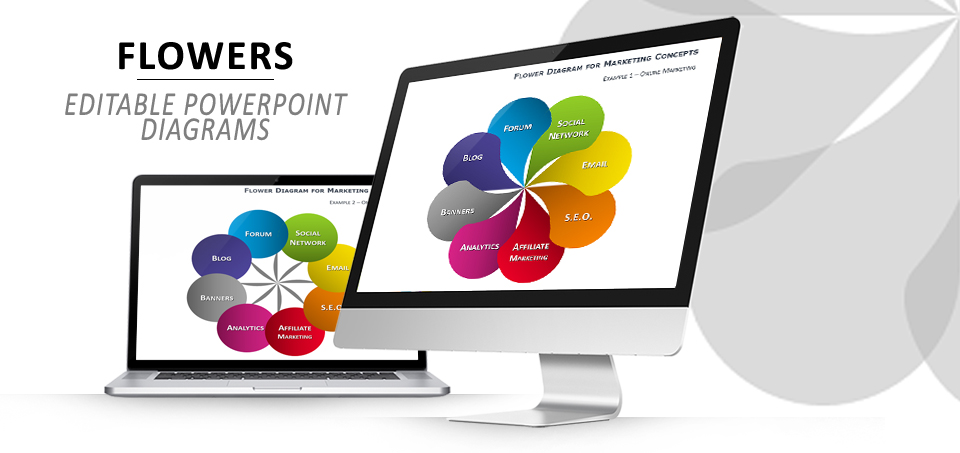
Free flower diagrams for PowerPoint with 8 petals. These pre-designed diagrams made of 8 fully editable shapes are especially suitable for marketing or business concepts.
Free creative templates for PowerPoint and Google Slides
Free flower diagrams for PowerPoint with 8 petals. These pre-designed diagrams made of 8 fully editable shapes are especially suitable for marketing or business concepts.
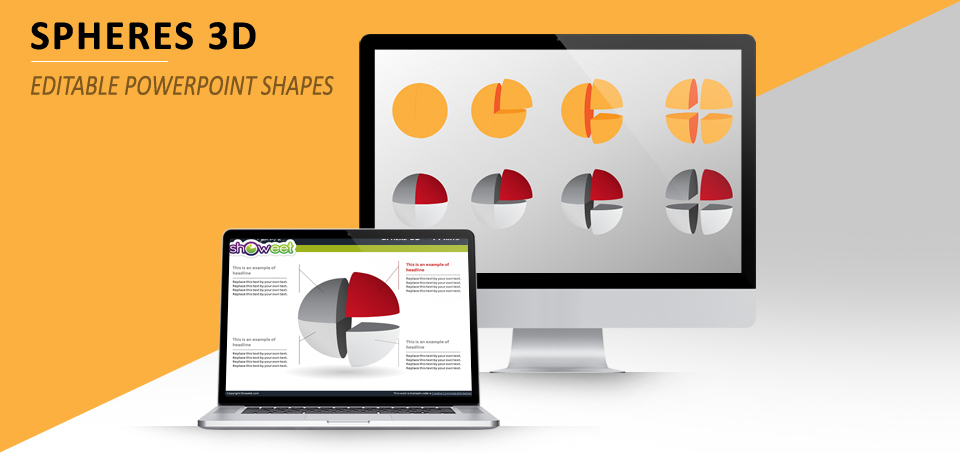
Free editable spheres 3D diagram shapes for PowerPoint. With 4 parts / slices that can be separated. A creative way to make your matrix more visual.
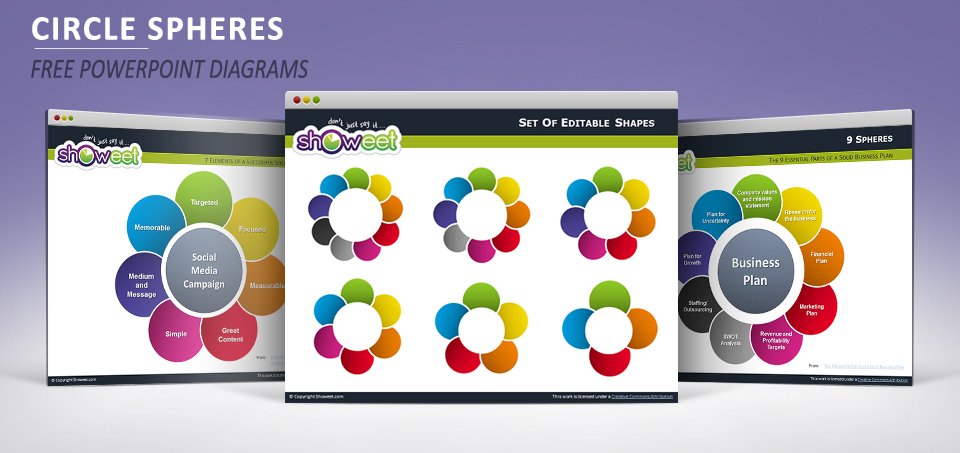
Free circle spheres for PowerPoint. Pre-designed diagrams made of 9 to 4 fully editable shapes. Also known as radial diagrams or even Venn diagrams, the use of these overlapping spheres is great to illustrate a Process Cycle, or the main elements of a strategic model.
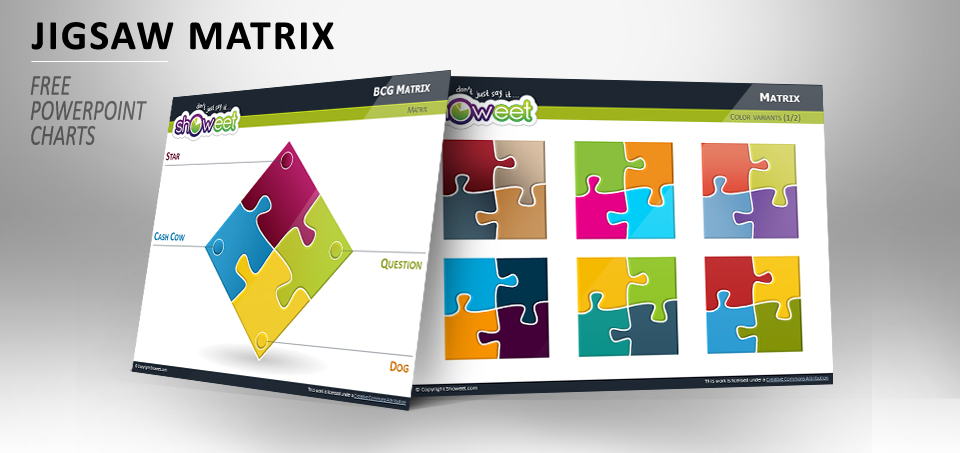
Showeet’s back with this free 2×2 matrices with jigsaw puzzle pieces for PowerPoint. Fully editable shapes. With examples for SWOT Analysis, BCG or 4-P marketing mix matrix. Also released with different color-schemes.
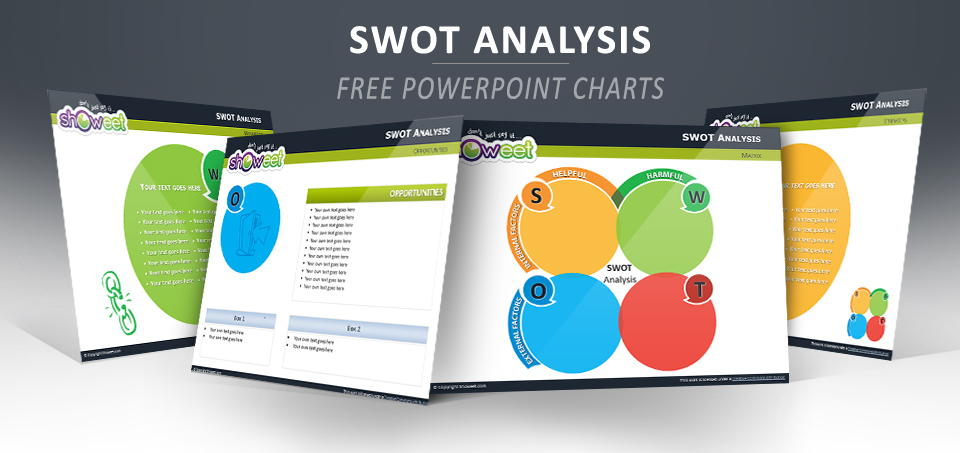
Third variant of free SWOT analysis template for PowerPoint. Creative design with round shapes for the four quadrants of the matrix.
Where am I? In business analysis, it is key to know and understand how your company fits in and interacts with the surrounding environment on both an internal and external view.
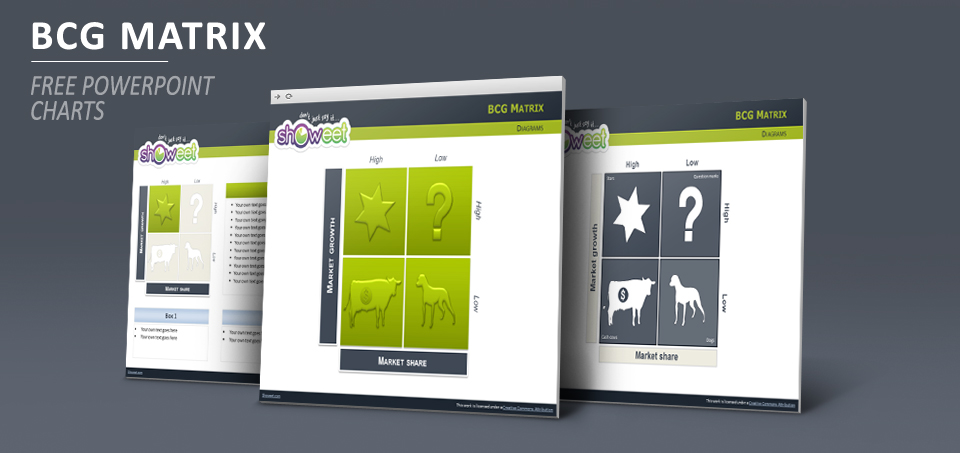
Free professional BCG Matrix Charts for PowerPoint. Includes 14 high quality slides with editable (i.e. easily customizable) graphics.
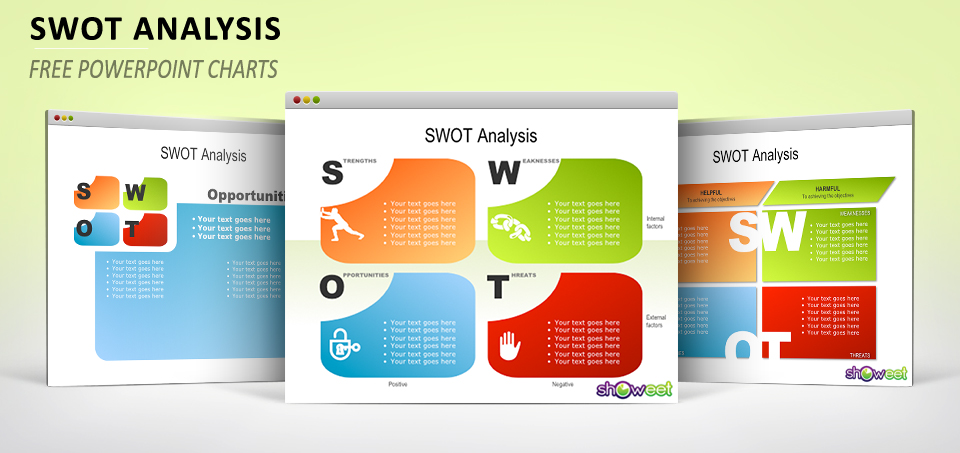
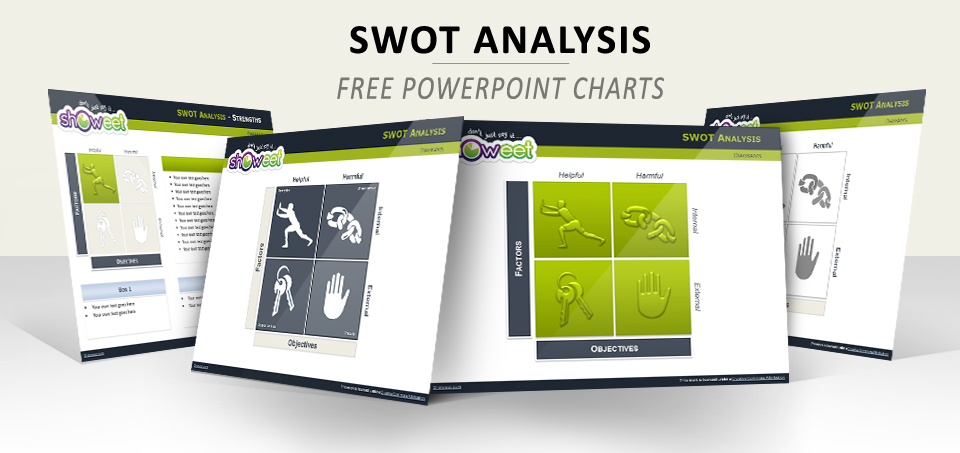
SWOT analysis free Powerpoint charts. Includes 10 high quality slides with editable graphics.