Charts & diagrams
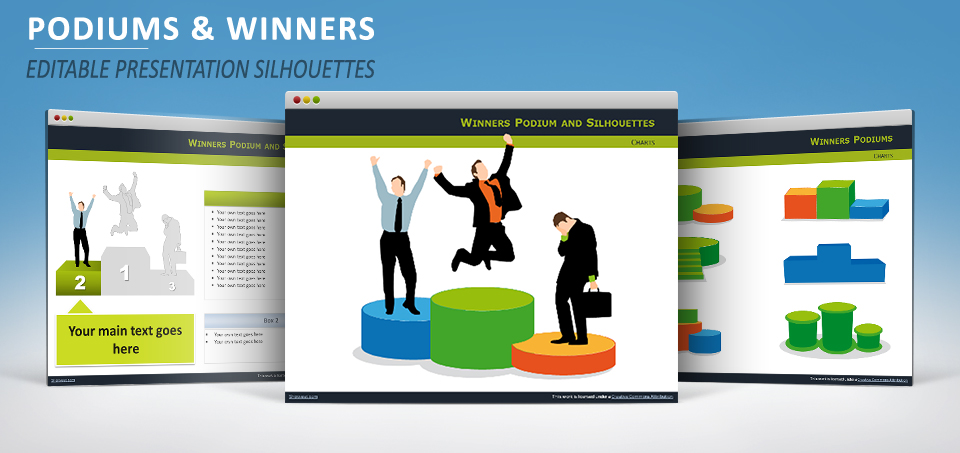
Free Winners Podiums with Silhouettes for Powerpoint and Impress
Various winner podium designs, colors and effects with 3 editable silhouettes of businessmen (2 winners, 1 loser) for Powerpoint and Impress.
Free creative templates for PowerPoint and Google Slides
Various winner podium designs, colors and effects with 3 editable silhouettes of businessmen (2 winners, 1 loser) for Powerpoint and Impress.
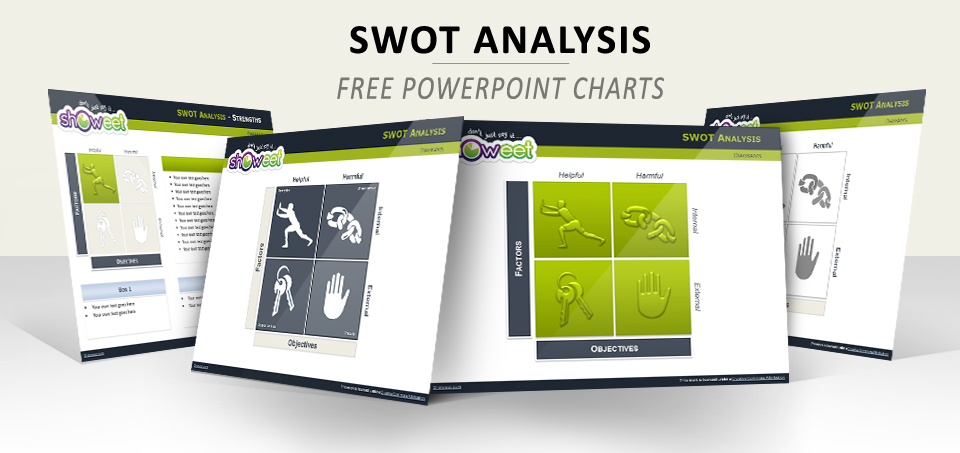
Where am I? In business analysis, it is key to know and understand how your company fits in and interacts with the surrounding environment on both an internal and external view.
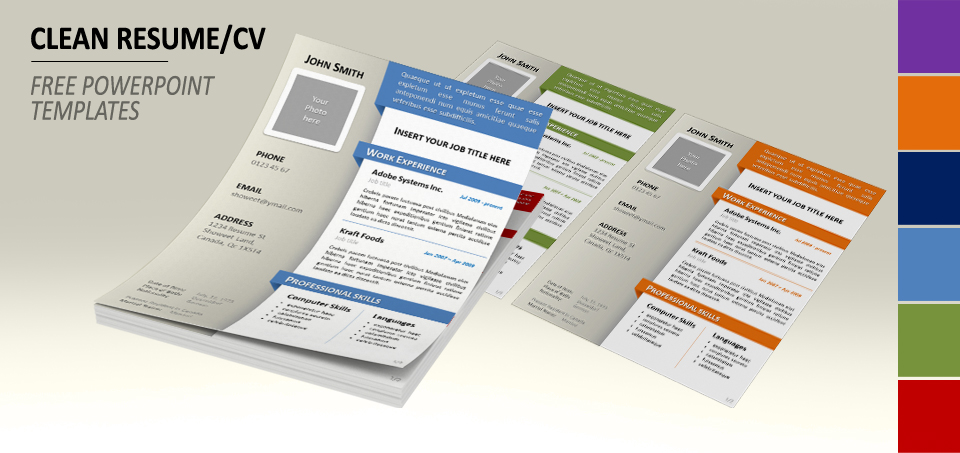
Free premium simple and clean curriculum vitae template for Powerpoint, coming with 6 different color styles:
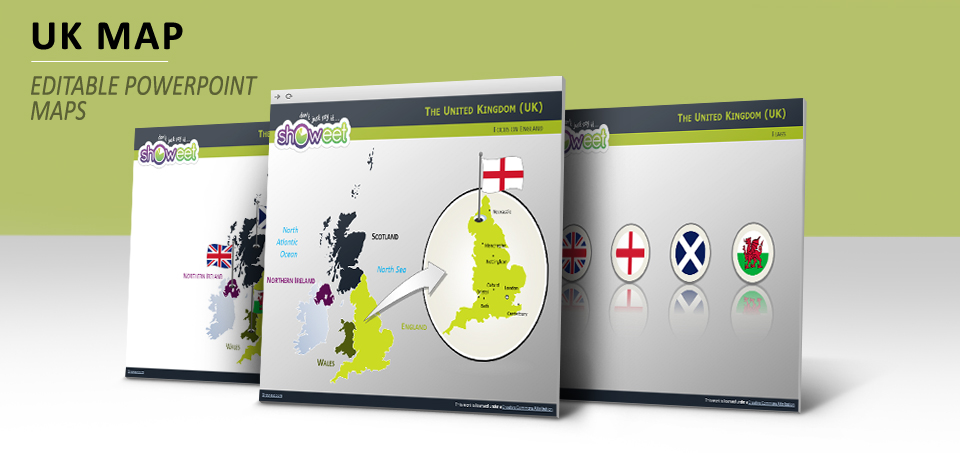
Editable maps of the United Kingdom with outline countries (England, Scotland, Wales and Northern Ireland) for your PowerPoint presentations.
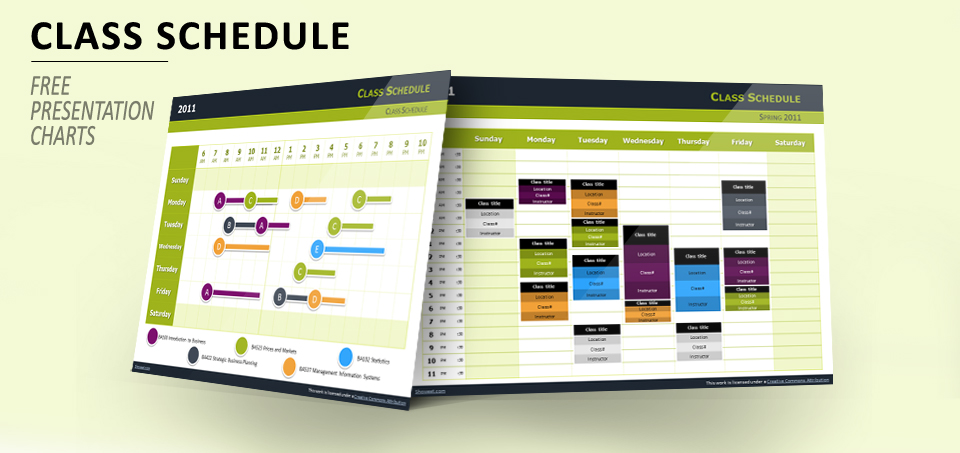
Free Weekly Class diagrams / schedule graphics for PowerPoint and Impress. Includes 4 high quality pre-designed slides with editable (i.e. easily customizable) graphics.
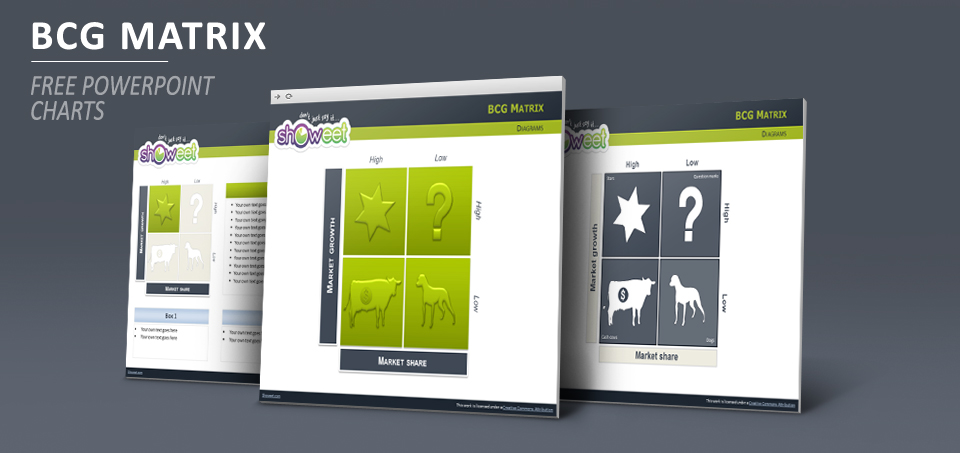
Free professional BCG Matrix Charts for PowerPoint. Includes 14 high quality slides with editable (i.e. easily customizable) graphics.
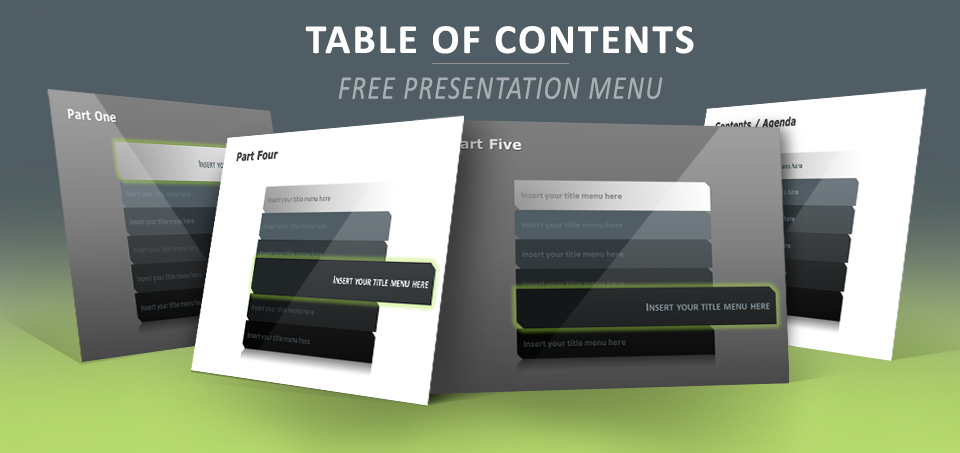
Theme for predesigned table of contents for PowerPoint and Impress. Useful for long presentations or to structure navigation. Example for 6 parts. Dark or White background.
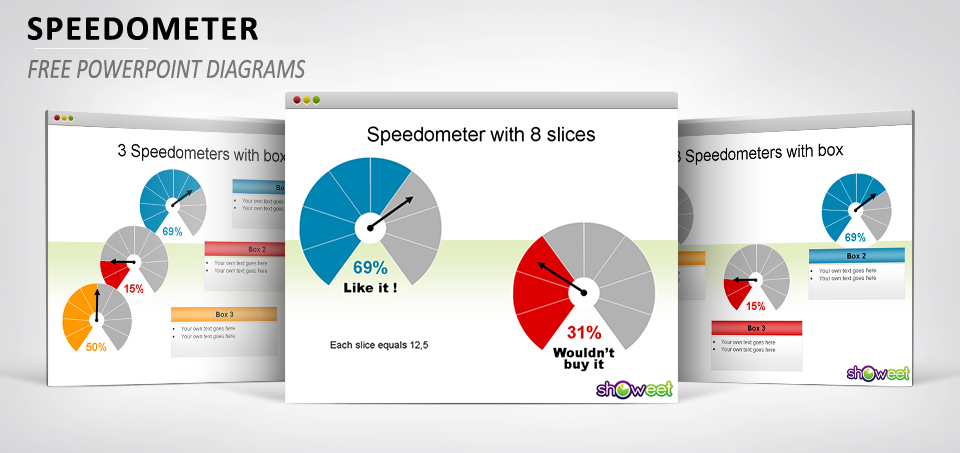
Minimalist easy-to-use speedometer chart for PowerPoint and Impress. The 2nd Speedometer release. Includes 5 slides.