Charts & diagrams
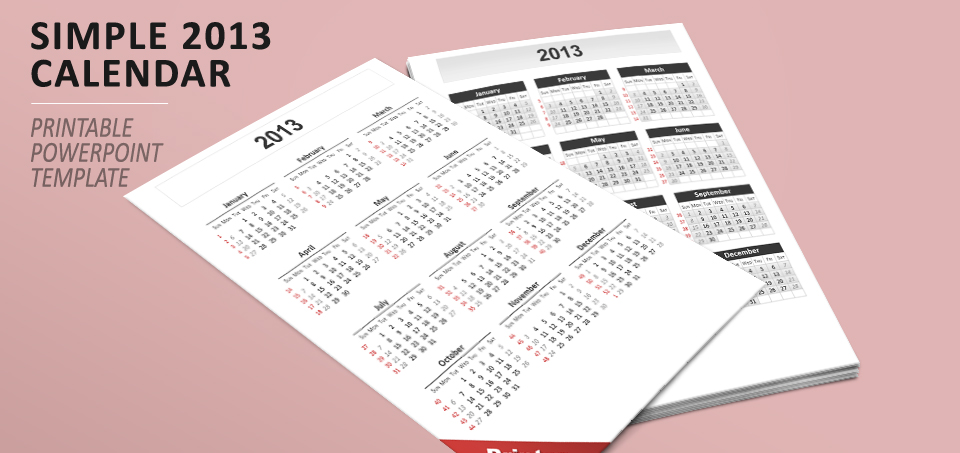
Simple Calendar 2013 for PowerPoint
Free printable calendar 2013 template for PowerPoint. Portait layout, with 12 months overview. Includes a printer friendly page.
Free creative templates for PowerPoint and Google Slides
Browse our extensive collection of charts and diagrams for Google Slides and PowerPoint. 100% free downloads.
Editable, easily customizable, and professional graphics.
Free printable calendar 2013 template for PowerPoint. Portait layout, with 12 months overview. Includes a printer friendly page.
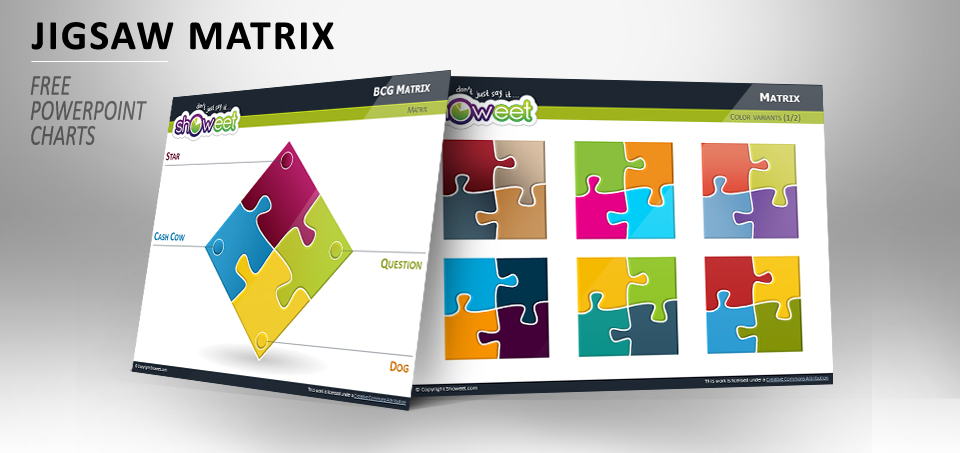
Showeet’s back with this free 2×2 matrices with jigsaw puzzle pieces for PowerPoint. Fully editable shapes. With examples for SWOT Analysis, BCG or 4-P marketing mix matrix. Also released with different color-schemes.
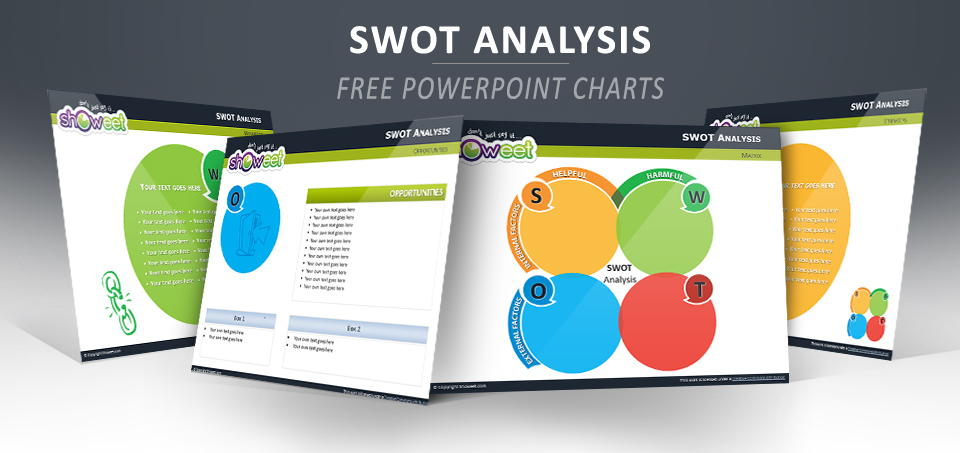
Third variant of free SWOT analysis template for PowerPoint. Creative design with round shapes for the four quadrants of the matrix.

Rounded square mosaic layer effect for photos in PowerPoint. Use this free and easy to use layer to create special effects for the photos you use in your PowerPoint presentations.
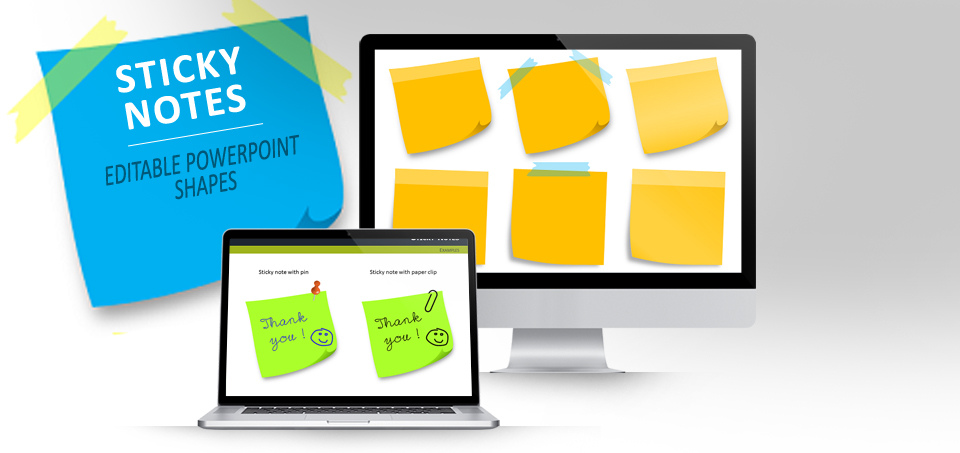
Free set of fully editable sticky notes in different colors. Comes also with editable adhesive tape and pin collection.
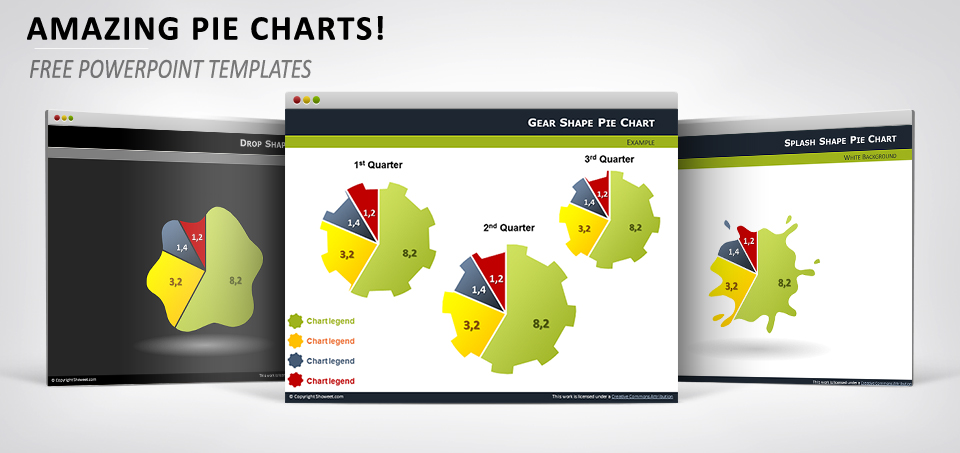
Turn your boring pie charts into surprising and innovative illustrations. These free editable shapes for Powerpoint are to be used with your usual data-driven pie charts.
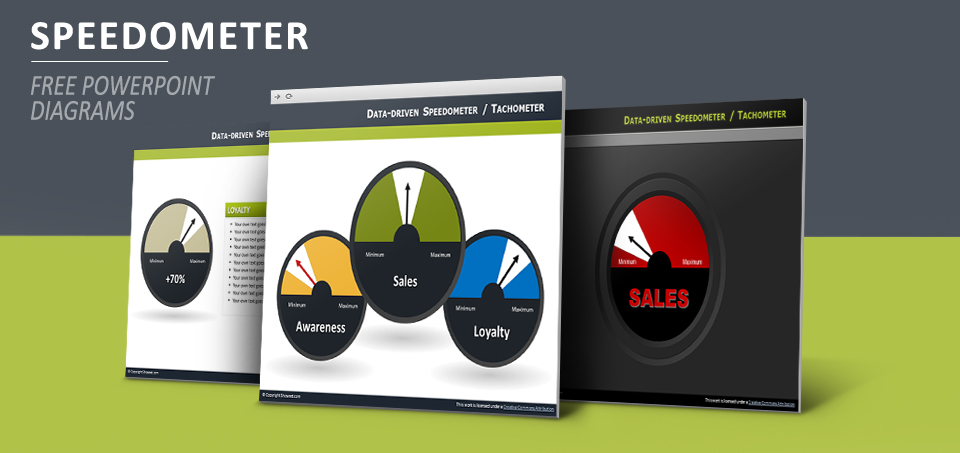
Free data-driven dashboards (also known as speedometers or tachometers) diagrams for PowerPoint.
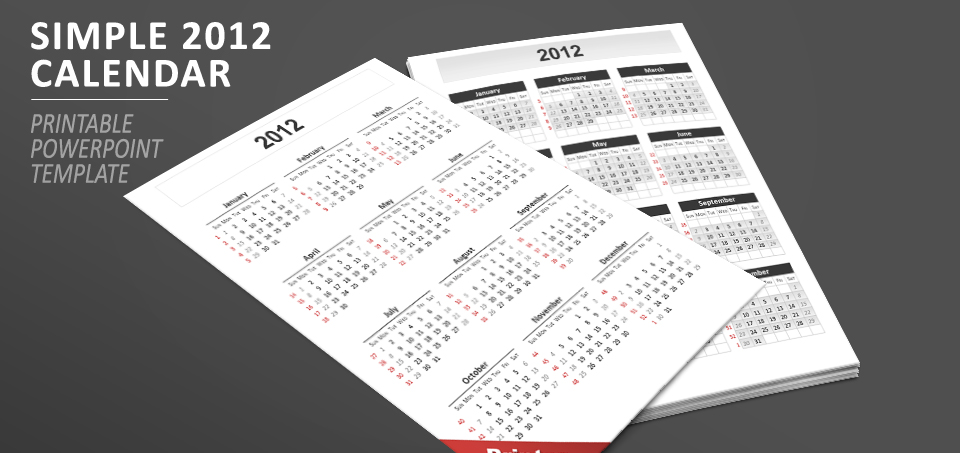
Free printable calendar 2012 for Powerpoint. Portait layout, with 12 months overview. Includes a printer friendly page.