
Collection of free infographic elements for PowerPoint and Google Slides presentations. 31 exclusive editable graphics. Easy-to-use and to customize.
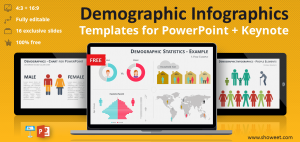
These infographics are great to be used in your slides to make a better visual impact. Use them to make your message more understandable, more relatable, and engaging.
This new collection complements the previous/first (very popular) infographic elements released a while ago. Keep it preciously in your must-have graphics for your next presentations!
This set contains 31 creative, exclusive, and fully editable infographics, with text placeholders.
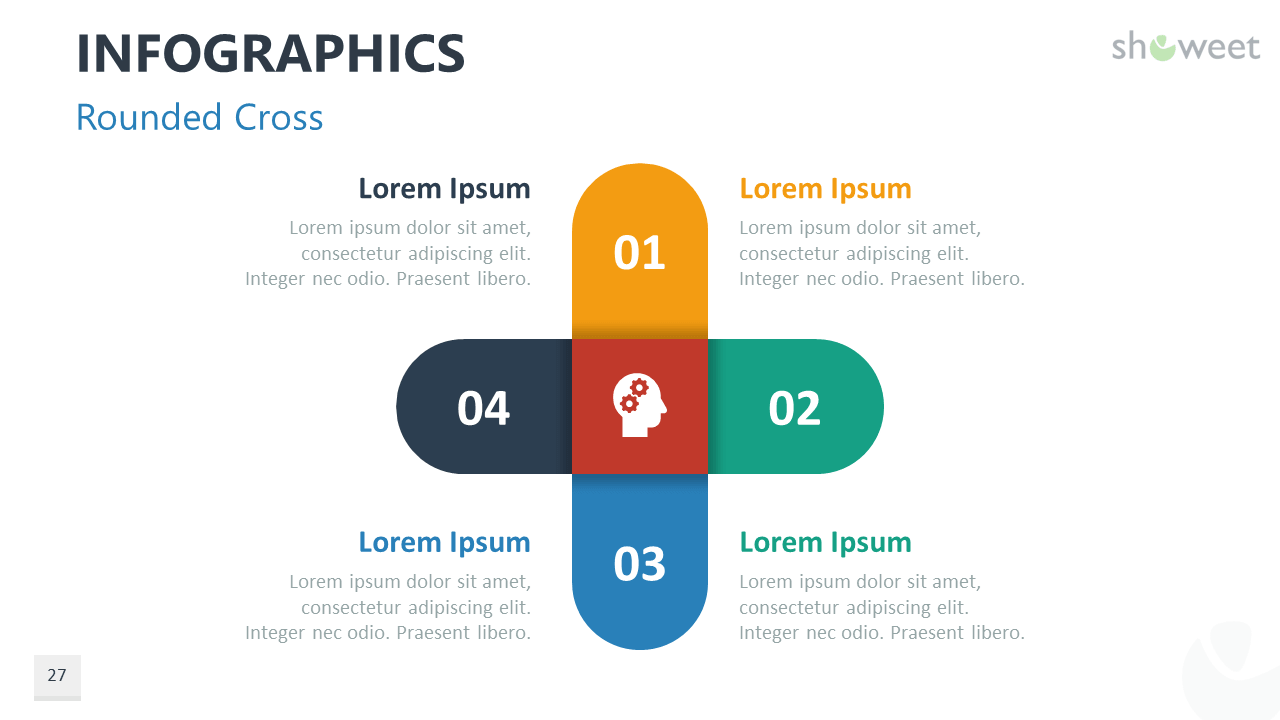
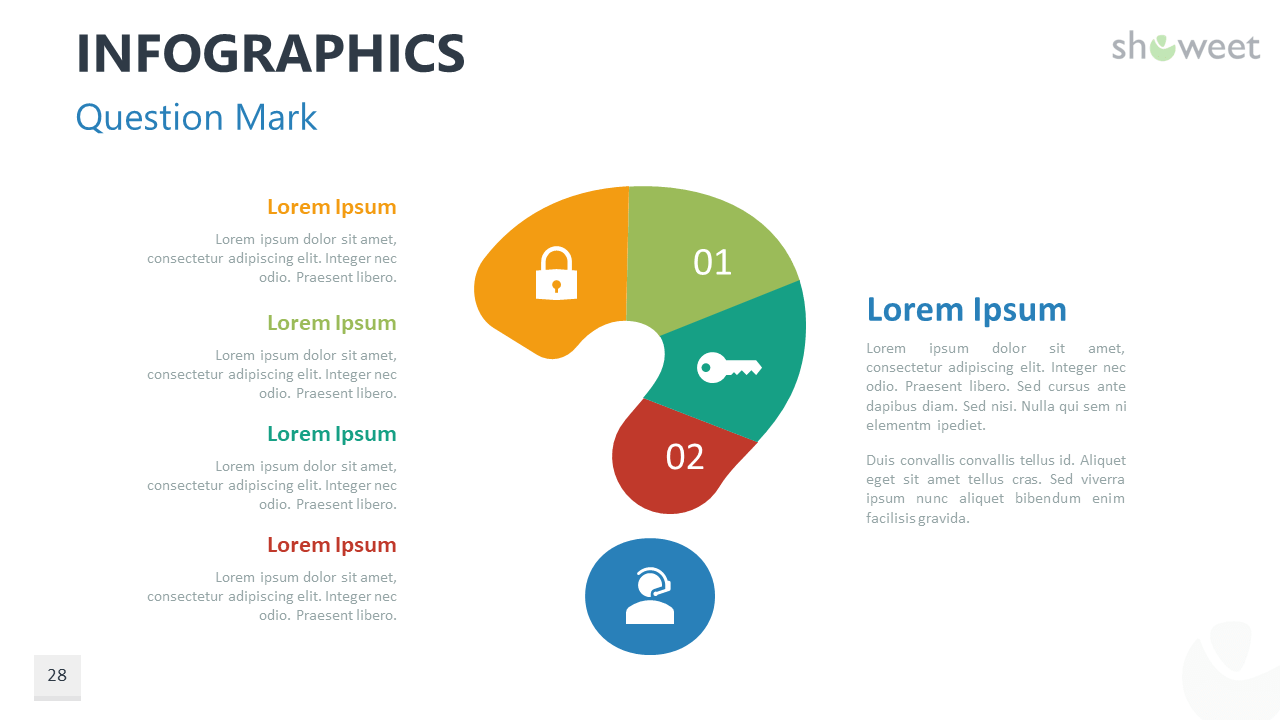
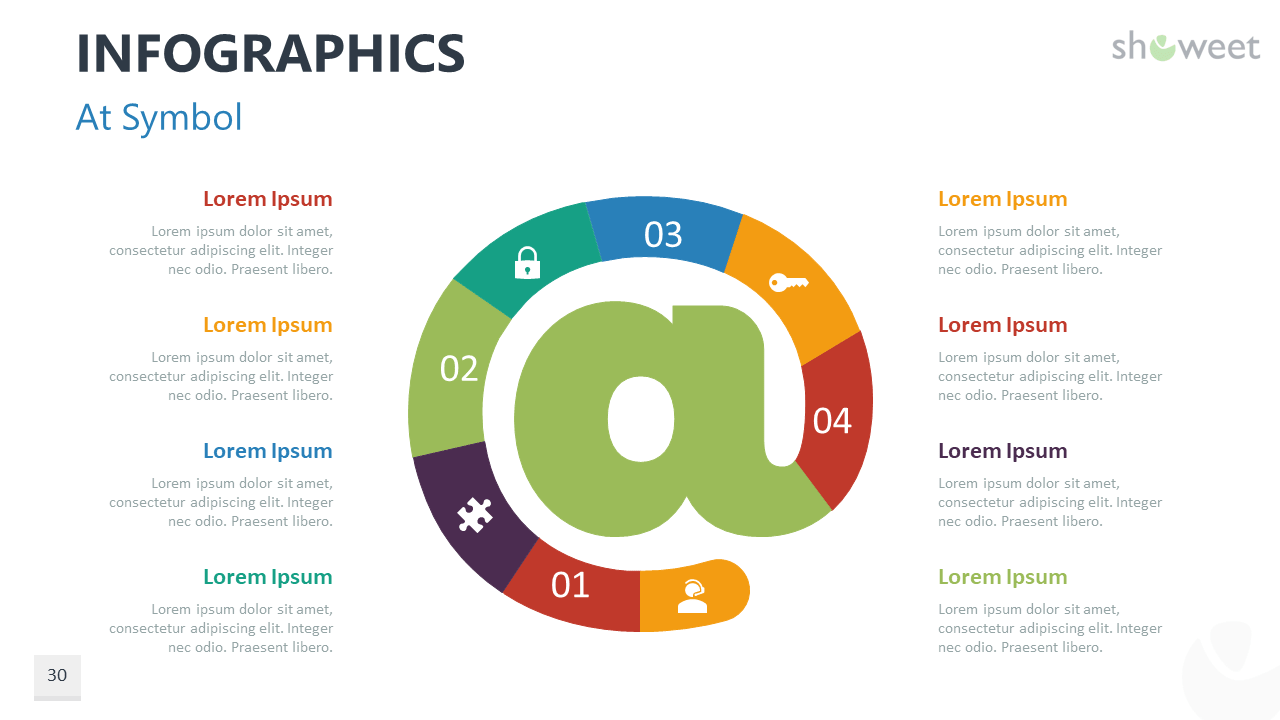
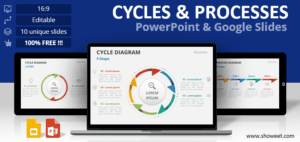
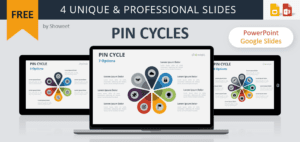
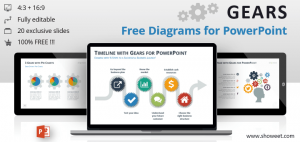
Pick the perfect infographics you need from a complete range of design options like radial bar charts, chain wheel cycles, braided cycles, cycle diagrams, dashboard, step-up/down processes, and different symbols.
2 (optimized) size layouts are available for your convenience: standard (4:3 screen ratio) and widescreen (16:9).

The document ‘Infographic Elements for PowerPoint and Google Slides’ features:
- 31 pre-designed unique, clean and professional slides
- Fully editable content (graphics and text) via PowerPoint – No Photoshop needed!
- Aspect ratios: Standard (4:3), Widescreen (16:9)
- Formats: PowerPoint (.PPTX) – created with PowerPoint for Office 365 and for Google Slides (Cf. below)
- License: Free – Attribution (please read carefully the ‘Terms of Use‘ before using this template, restrictions may apply)
Free font used:
- Calibri (System font)
Slides included:


Comments are closed.