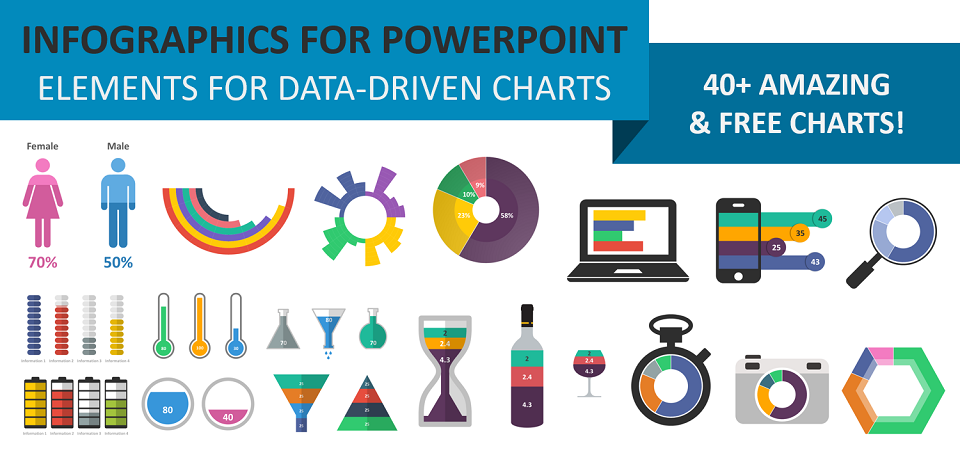
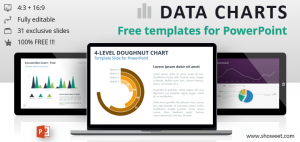
Free charts and infographics PowerPoint templates. Easy and beautiful way to conveying your information in your presentation. PPTX document contains various data-driven chart examples with visually appealing and unique editable shapes.
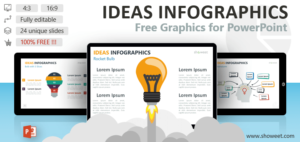
Avoid boring presentations: use graphics instead! These information visual designs will allow you to present complex information quickly and clearly in an easy to understand visual manner. You can custom your own data with pre-designed and embedded data-driven charts.
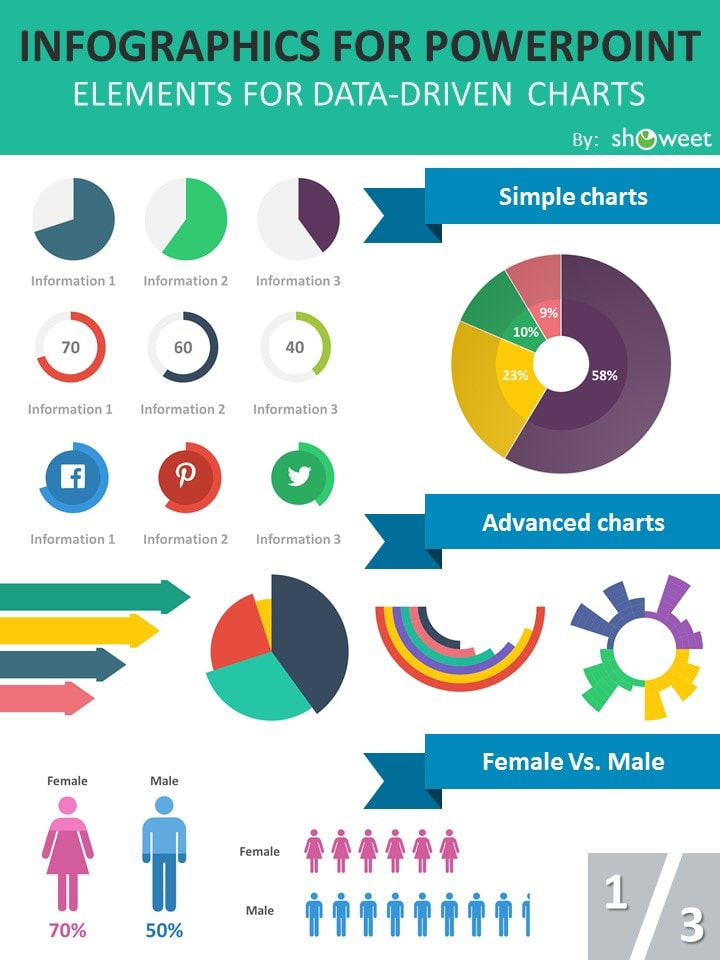
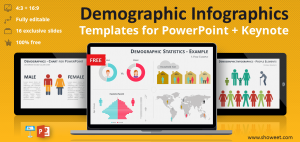
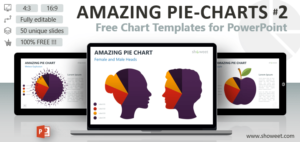
These infographics templates include 43 pre-made charts: simple and advanced charts (e.g. radial charts), Males vs. Female infographics, and beautiful designs using column, bar and pie charts.
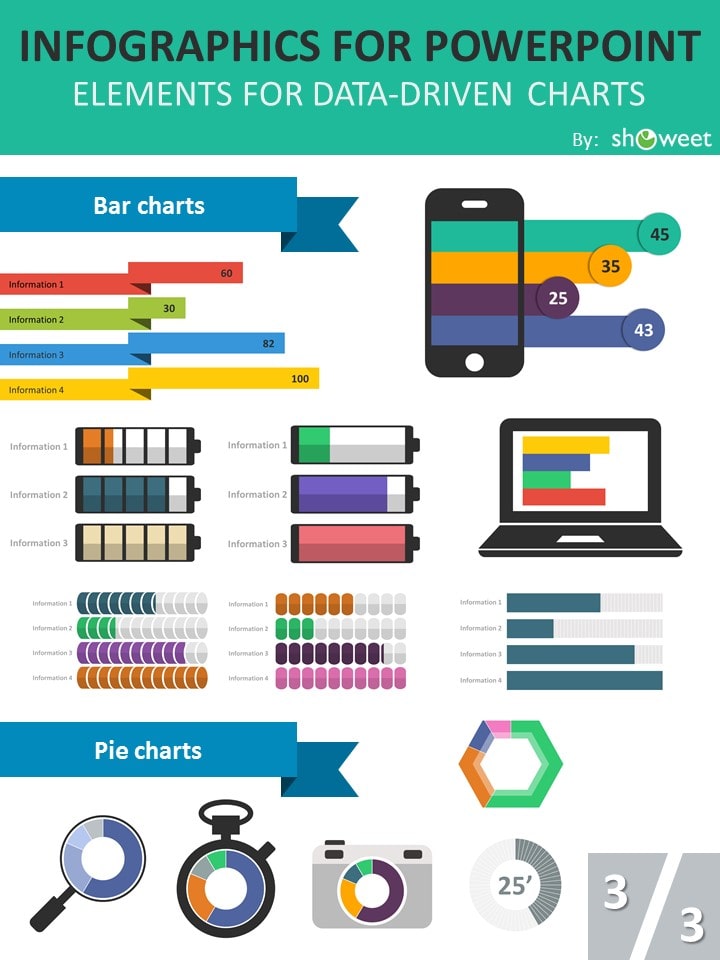
Unique data-driven chart templates:
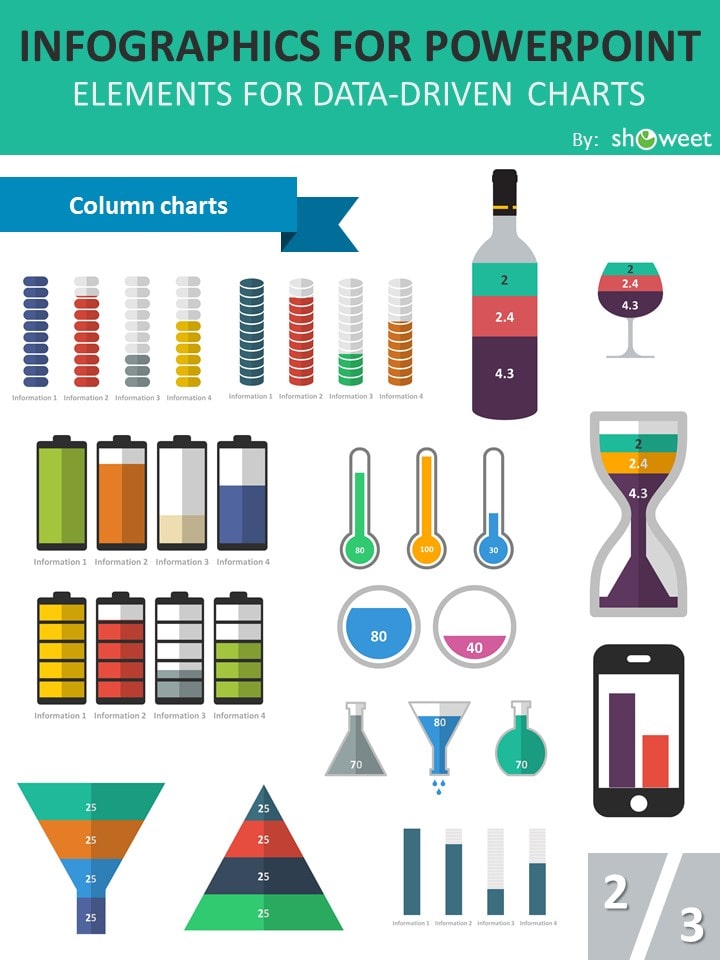
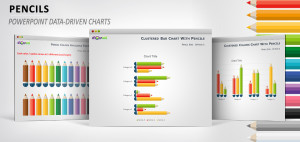
- Column charts: hourglass, wine (bottle + glass), chemistry, thermometer, bubbles, cellular, pyramid, coins, pills, batteries
- Bar charts: cellular, laptop, banners, coins, pills, batteries
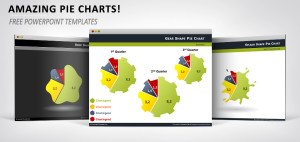
- Pie charts: camera, magnifying glass, chronometers, pentagon
Also comes with Windows Metafile (WMF) graphics: you can insert them on your PowerPoint document, edit them and optimize the colors as needed.
The ‘Charts & Infographics PowerPoint Templates’ document features:
- 43 pre-designed unique, clean and professional charts and infographic elements
- Editable elements
- Data-driven charts (can be edited using the built-in diagram function of PowerPoint)
- Aspect ratio: Widescreen (16:9)
- Format: PowerPoint (.PPTX)
- License: Free – Attribution (please read carefully the ‘Terms of Use‘ before using this template, restrictions may apply)
Slides included:
Slide size: widescreen (16:9)
White background version:


Dark background version:


Comments are closed.