Charts & diagrams
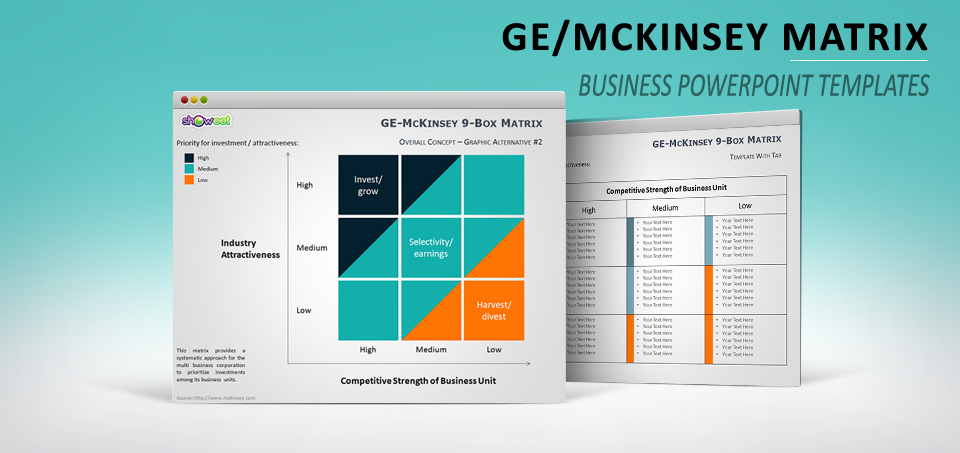
GE/McKinsey Matrix for PowerPoint
Free GE/McKinsey matrix templates for PowerPoint. Presentation document that contains 8 slides.
Creative and free PowerPoint templates
Free GE/McKinsey matrix templates for PowerPoint. Presentation document that contains 8 slides.
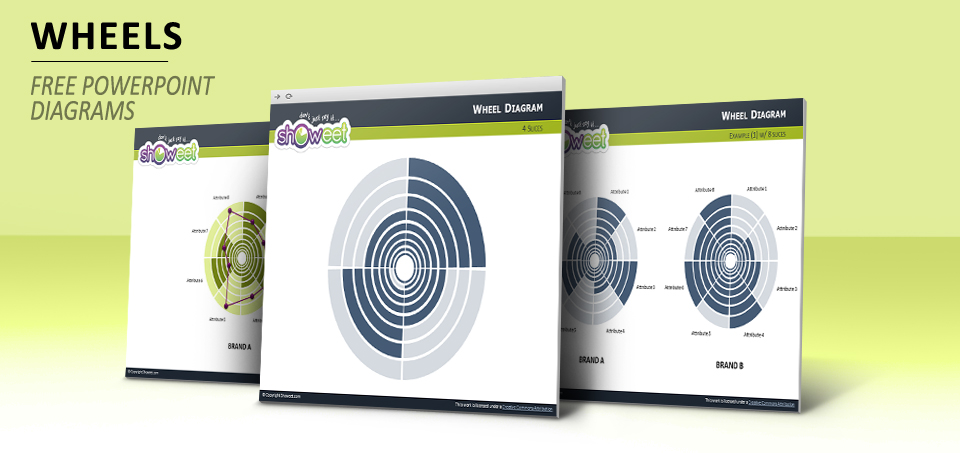
Free wheel diagrams (also known as spider, radar or radial charts) for PowerPoint.
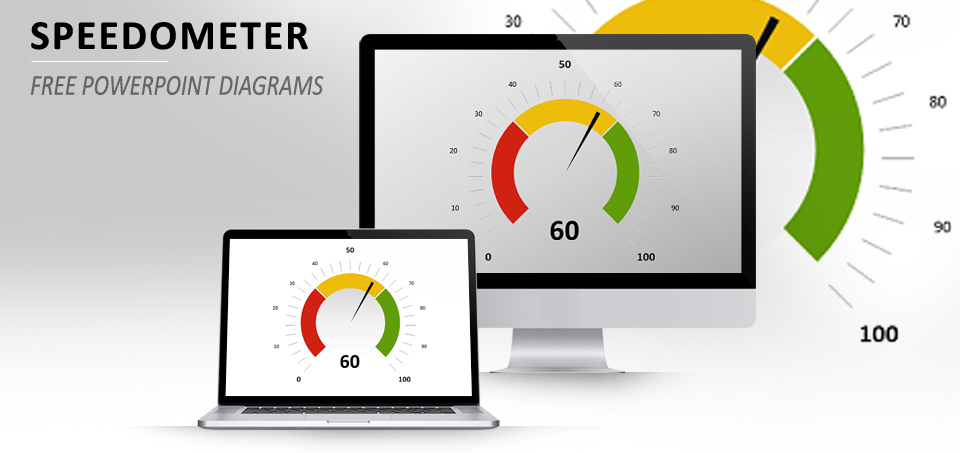
Yet another free data-driven speedometer for PowerPoint. Great to be used for visual presentation of performance measures on a 0-100 scale.
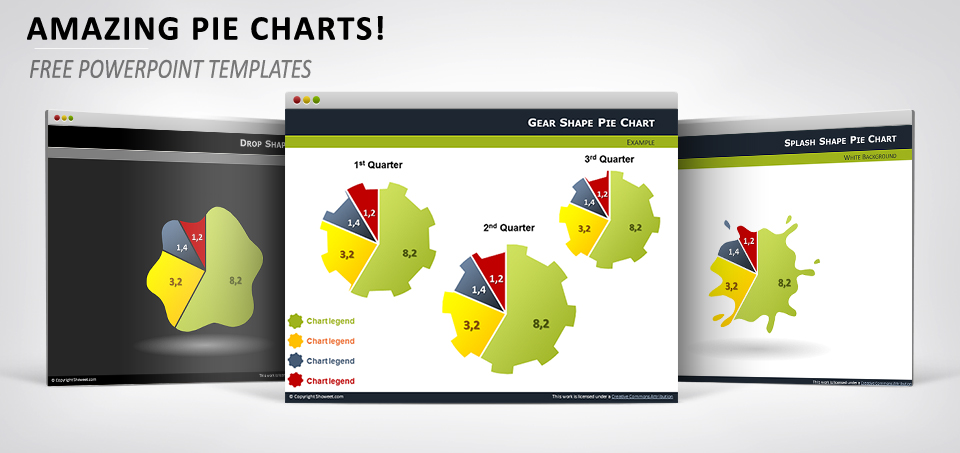
Turn your boring pie charts into surprising and innovative illustrations. These free editable shapes for Powerpoint are to be used with your usual data-driven pie charts.
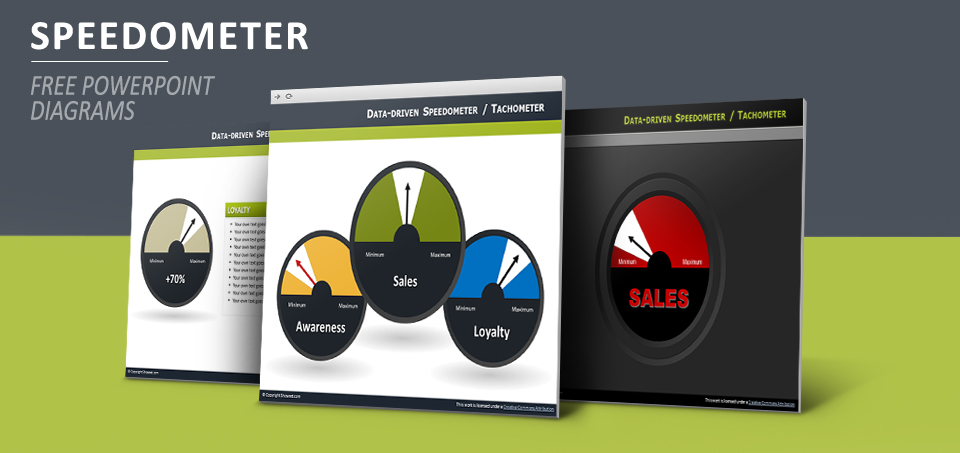
Free data-driven dashboards (also known as speedometers or tachometers) diagrams for PowerPoint.
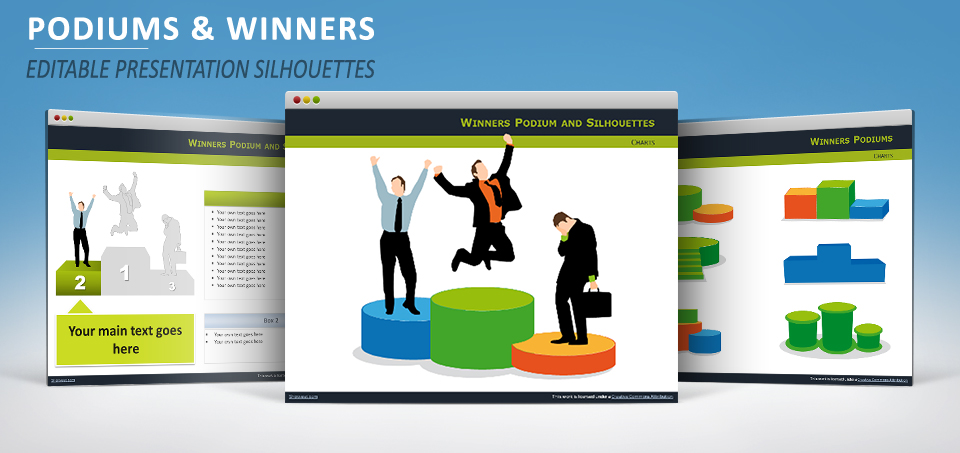
Various winner podium designs, colors and effects with 3 editable silhouettes of businessmen (2 winners, 1 loser) for Powerpoint and Impress.
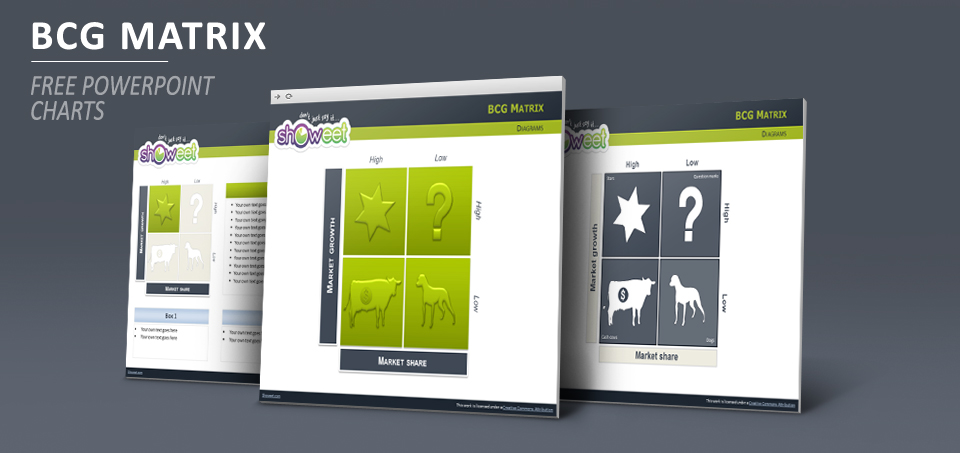
Free professional BCG Matrix Charts for PowerPoint. Includes 14 high quality slides with editable (i.e. easily customizable) graphics.
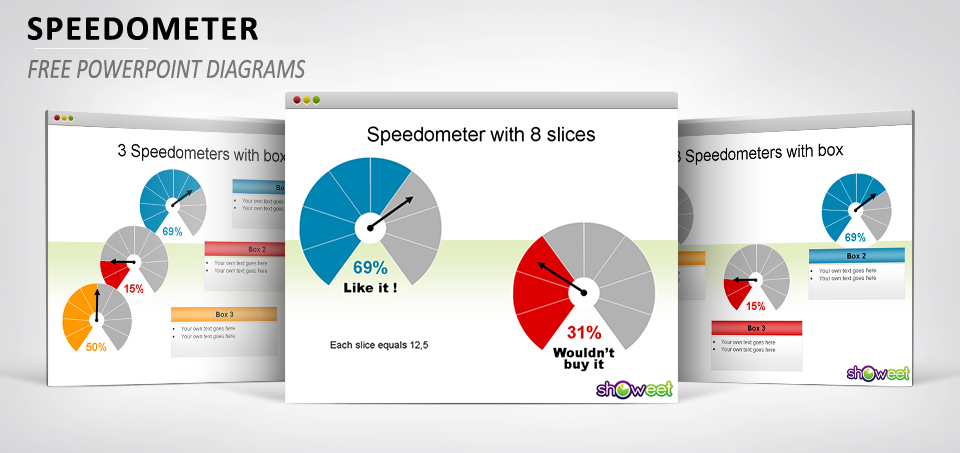
Minimalist easy-to-use speedometer chart for PowerPoint and Impress. The 2nd Speedometer release. Includes 5 slides.