Charts & diagrams
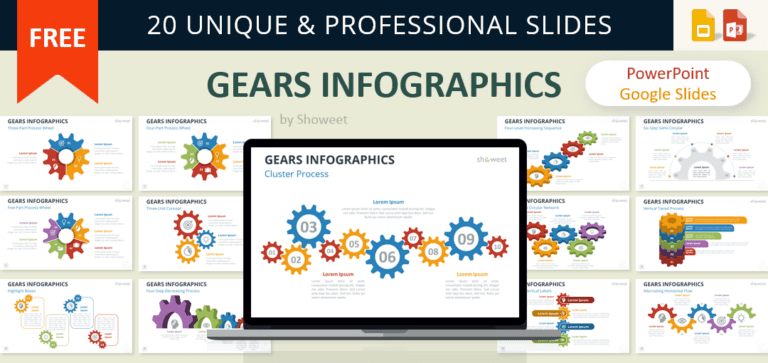
Gears Infographics for PowerPoint and Google Slides
Use this set of 20 editable diagrams to present connected ideas, clarify workflows, and guide audiences through engaging multi-step concepts.
Free creative templates for PowerPoint and Google Slides
Use this set of 20 editable diagrams to present connected ideas, clarify workflows, and guide audiences through engaging multi-step concepts.
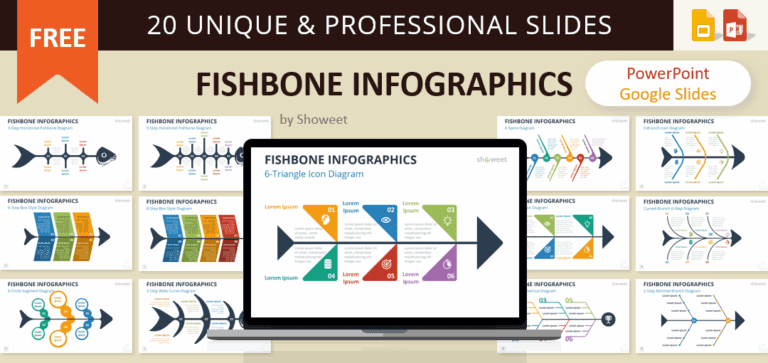
Present causes, effects, and processes with vibrant, editable diagrams that keep your audience focused and engaged.
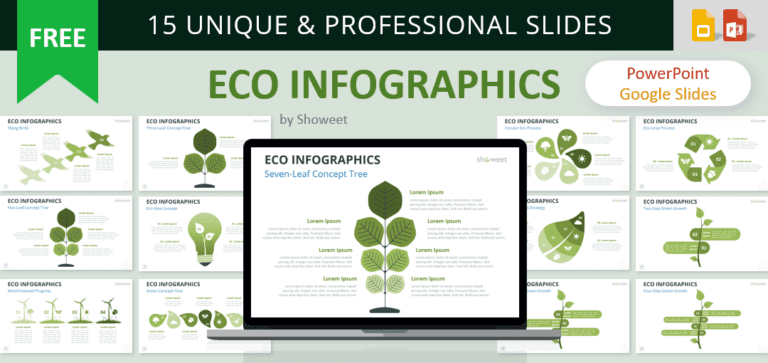
Visualize eco concepts and green strategies with 15 creative, editable slides designed to simplify and enhance your message.
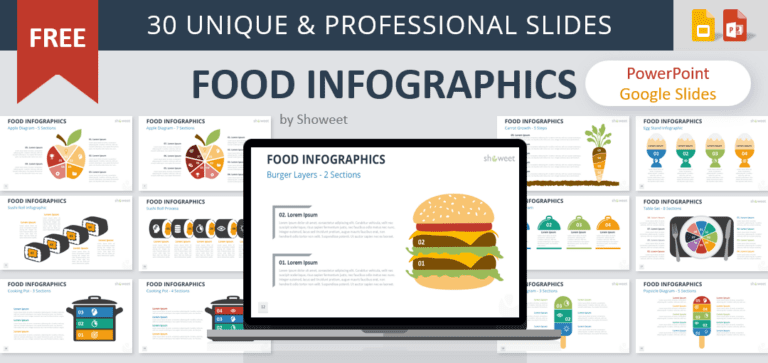
Add flavor to your presentations with these 30 professionally designed food-shaped diagrams perfect for nutrition, culinary, and food business topics.

Unlock solutions and showcase processes with this fully editable, key-themed infographic template for presentations.

Download and get 15 slides featuring transport-themed visuals, perfect for presenting logistics and data in a professional layout.

Enhance your slides with professional Cycle Pin Diagrams, offering versatile 5-8 option layouts for compelling visual storytelling.

Explore Neumorphic Diagrams for PowerPoint & Google Slides: 32 editable, professional slides for impactful presentations in a modern 3D style.