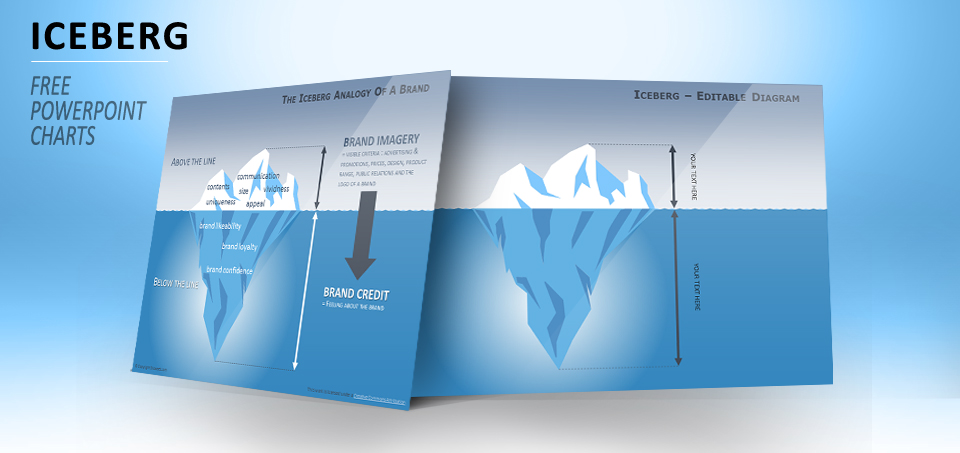
Free circle spheres for PowerPoint. Pre-designed diagrams made of 9 to 4 fully editable shapes. Also known as radial diagrams or even Venn diagrams, the use of these overlapping spheres is great to illustrate a Process Cycle, or the main elements of a strategic model. Comes with various examples: Business Plan, E-Learning Strategy, Social Media Campaign, The McKinsey 7S Model, Mintzberg’s 5 Ps of Strategy, The Ansoff Matrix.
Marketing
Charts & diagrams
Wheel diagrams for PowerPoint
Free wheel diagrams (also known as spider, radar or radial charts) for PowerPoint.
A method for displaying multiple attributes simultaneously, wheel diagrams are often used for comparison. Includes 6 slides, with 3 different editable shapes (with 8, 6 and 4 slices) and with 3 examples.
Charts & diagrams
Product Life Cycle Diagrams for PowerPoint
Free editable Product Life Cycle diagrams for PowerPoint. Includes 6 high pre-designed quality slides with fully editable (i.e. easily customizable) graphics. Also known as maturity diagrams, these free premium business templates will suit student’s, teacher’s or professionnal’s (e.g. marketer’s or CEO’s) needs.
Charts & diagrams
Matrix with Jigsaw Puzzle Pieces for PowerPoint
Showeet’s back with this free 2×2 matrices with jigsaw puzzle pieces for PowerPoint. Fully editable shapes. With examples for SWOT Analysis, BCG or 4-P marketing mix matrix. Also released with different color-schemes.
Charts & diagrams
SWOT Analysis #3 – Free PowerPoint Charts
Third variant of free SWOT analysis template for PowerPoint. Creative design with round shapes for the four quadrants of the matrix. Acronym for Strengths, Weaknesses, Opportunities and Threats, the SWOT analysis is a strategic planning tool that provides managers with a critical snapshot of the organization’s internal and external environments.
Charts & diagrams
Amazing Pie Charts for PowerPoint
Turn your boring pie charts into surprising and innovative illustrations. These free editable shapes for Powerpoint are to be used with your usual data-driven pie charts. Includes 7 shapes (drop, flower, splash, cog-wheel, star, saw blade, gear), 11 high pre-designed quality slides with editable (i.e. easily customizable) graphics, along with tutorial.
Charts & diagrams
Speedometer 3 – Free Diagram for PowerPoint
Free data-driven dashboards (also known as speedometers or tachometers) diagrams for PowerPoint. Includes 4 high pre-designed quality slides with data-driven and editable (i.e. easily customizable) graphics, along with tutorial.
Charts & diagrams
Free Winners Podiums with Silhouettes for Powerpoint and Impress
Various winner podium designs, colors and effects with 3 editable silhouettes of businessmen (2 winners, 1 loser) for Powerpoint and Impress. Nice way to illustrate Winners (first, second, third place awards podium) like the most successful ideas and concepts for your presentations. Contains 9 slides.