Charts & diagrams
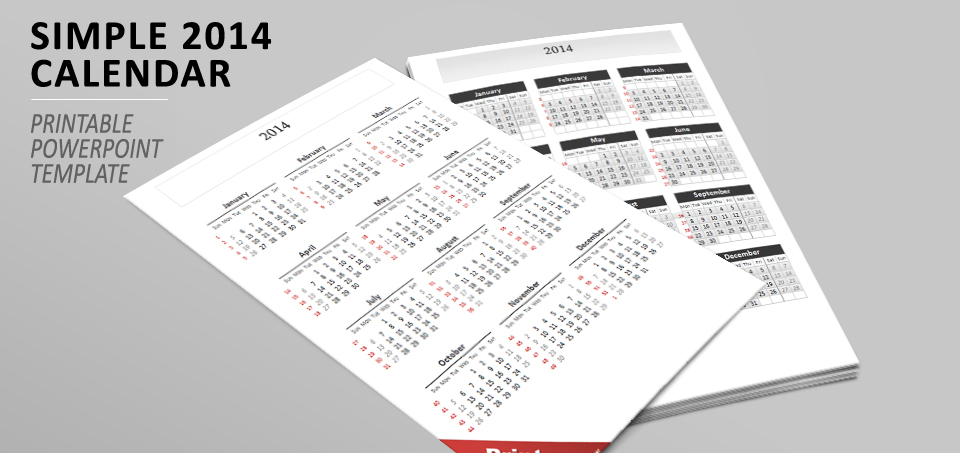
Simple Calendar 2014 for PowerPoint
Free printable calendar 2014 for PowerPoint. Portait layout, with 12 months overview. 2014 with date boxes and numbered weeks.
Free creative templates for PowerPoint and Google Slides
Browse our extensive collection of charts and diagrams for Google Slides and PowerPoint. 100% free downloads.
Editable, easily customizable, and professional graphics.
Free printable calendar 2014 for PowerPoint. Portait layout, with 12 months overview. 2014 with date boxes and numbered weeks.
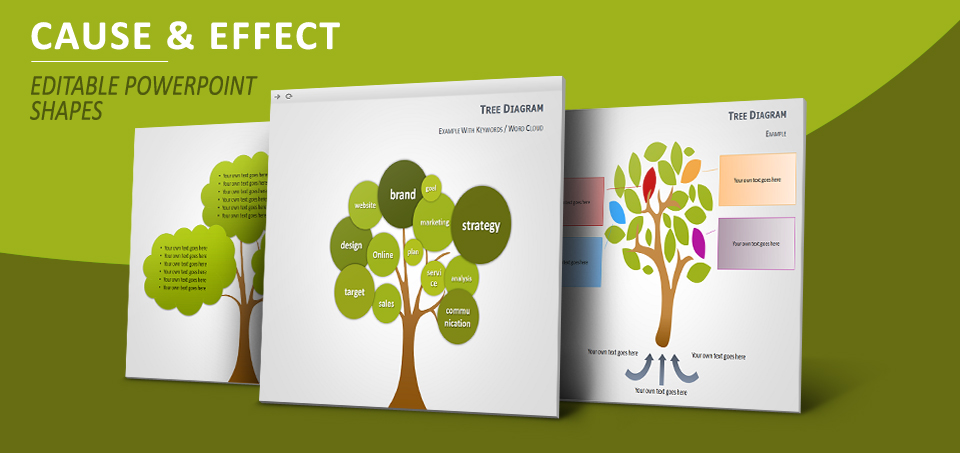
Free diagrams with editable trees and leaves for PowerPoint. These pre-designed diagrams are especially suitable to illustrate Cause and Effect relationships (Cause: “why it happens?” and Effect: “what happens?”) or Word/Tag clouds.
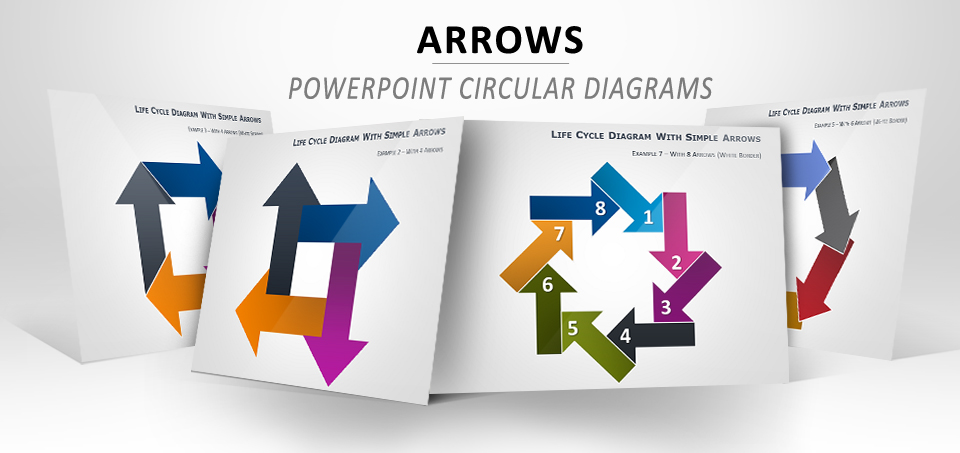
Free life cycle diagrams for PowerPoint with simple arrows. Pre-designed diagrams made of 4 to 8 fully editable shapes.
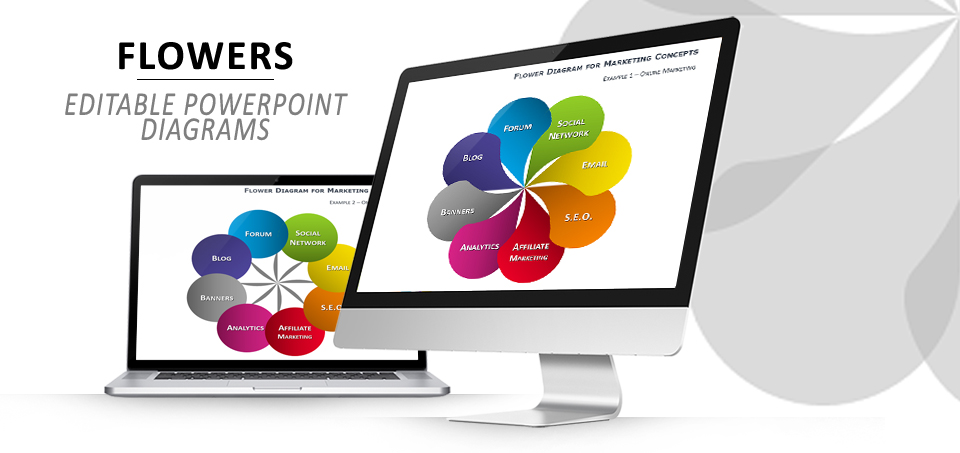
Free flower diagrams for PowerPoint with 8 petals. These pre-designed diagrams made of 8 fully editable shapes are especially suitable for marketing or business concepts.
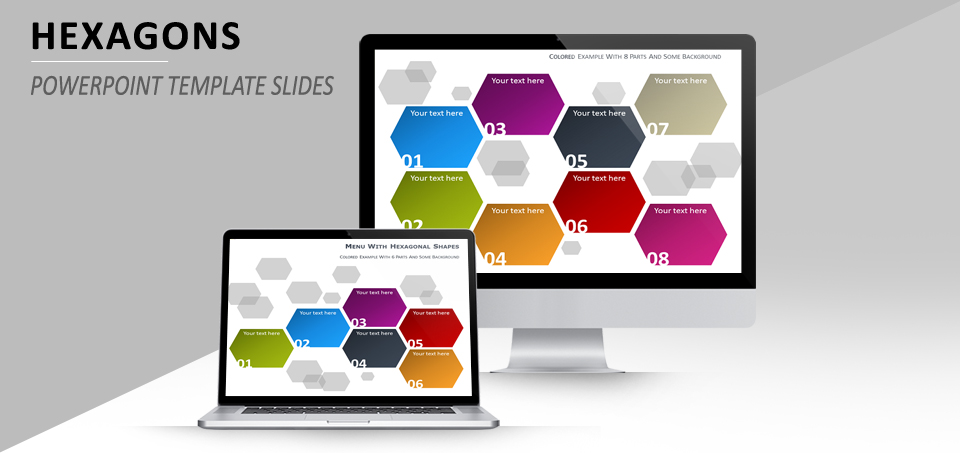
Another free colored menu for PowerPoint with hexagonal shapes (i.e. polygons with six edges and six vertices). This model can be used for introducing an agenda, table of contents of your presentation, main components or features.
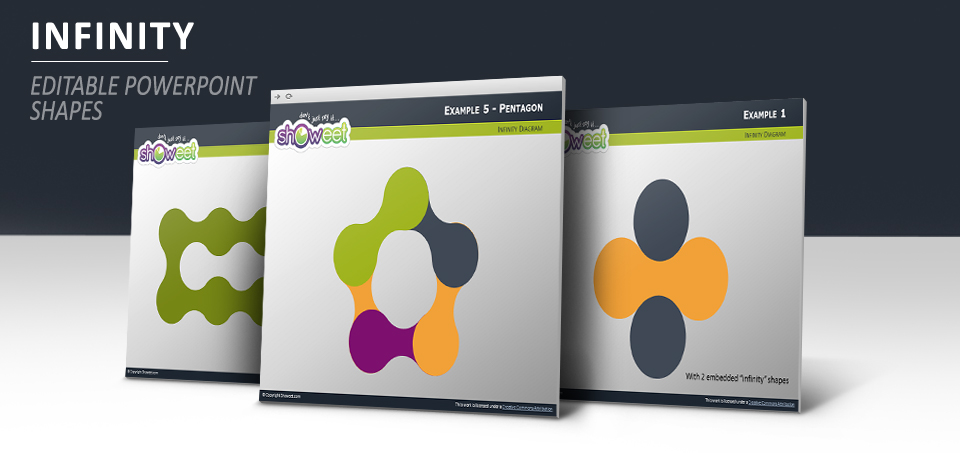
Free diagram shapes with infinity symbol for PowerPoint. Includes 8 slides, with the single editable infinity shape and with 7 examples.
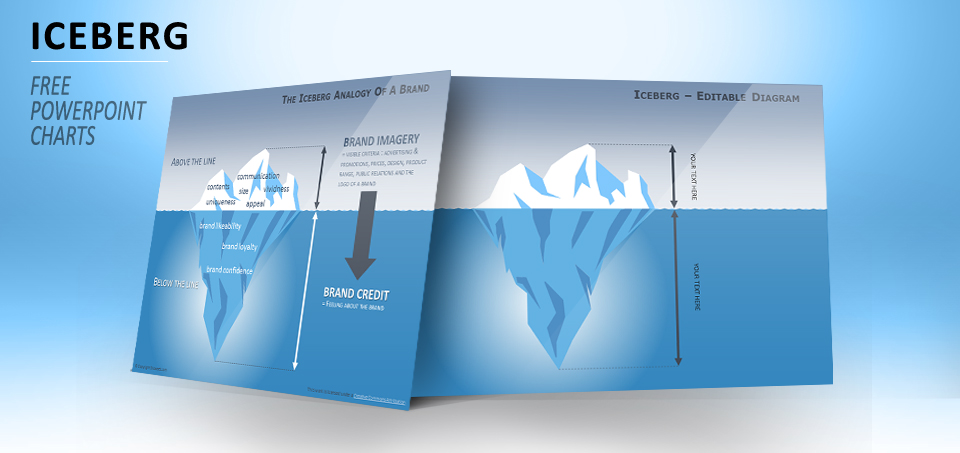
Free iceberg diagram for PowerPoint. Used in various fields (marketing, management, psychology, human resources, finance) the iceberg model is an analogy that allows to illustrate opposite or dual concepts. Includes 3 slides, with editable shapes and with 2 concrete examples: “The iceberg model of meaning”, and “The iceberg analogy of a brand”
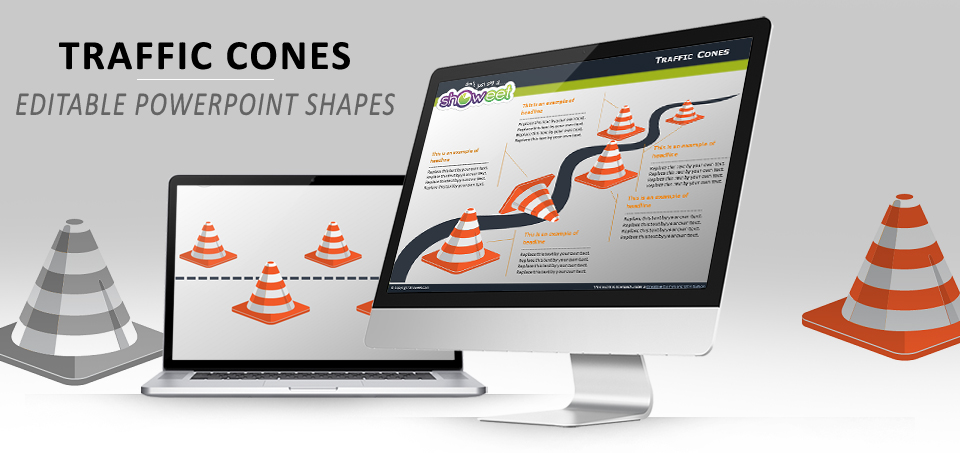
Free traffic cones zig zag path diagrams for PowerPoint. Fully editable shapes. Contains 5 slides.