Charts & diagrams
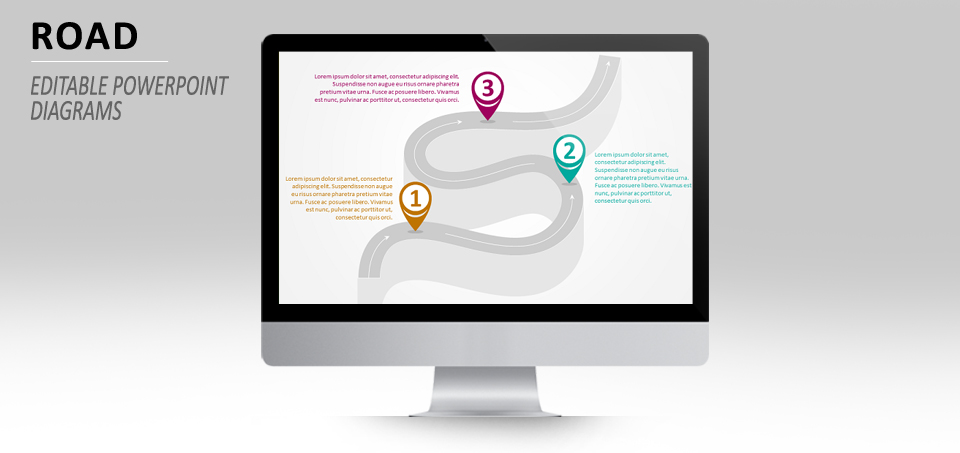
Road with 3 Map Pins Diagram for PowerPoint
Free diagram for PowerPoint with winding road and 3 colored map pins. Original way to illustrate three different parts, steps/stages or levels in your presentation.
Free creative templates for PowerPoint and Google Slides
Free diagram for PowerPoint with winding road and 3 colored map pins. Original way to illustrate three different parts, steps/stages or levels in your presentation.
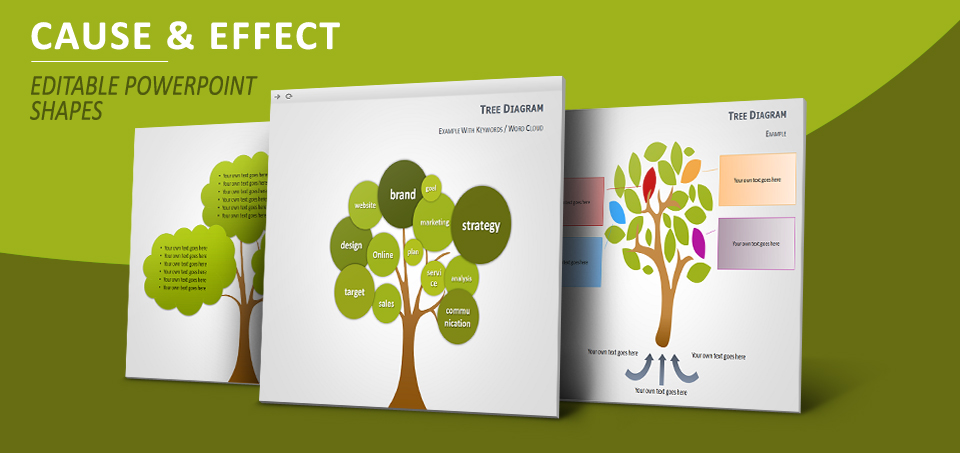
Free diagrams with editable trees and leaves for PowerPoint. These pre-designed diagrams are especially suitable to illustrate Cause and Effect relationships (Cause: “why it happens?” and Effect: “what happens?”) or Word/Tag clouds.
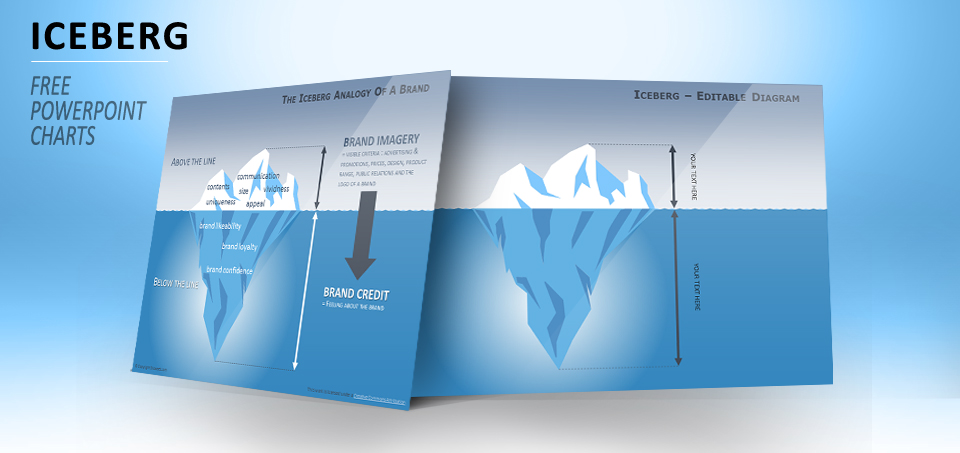
Free iceberg diagram for PowerPoint. Used in various fields (marketing, management, psychology, human resources, finance) the iceberg model is an analogy that allows to illustrate opposite or dual concepts. Includes 3 slides, with editable shapes and with 2 concrete examples: “The iceberg model of meaning”, and “The iceberg analogy of a brand”