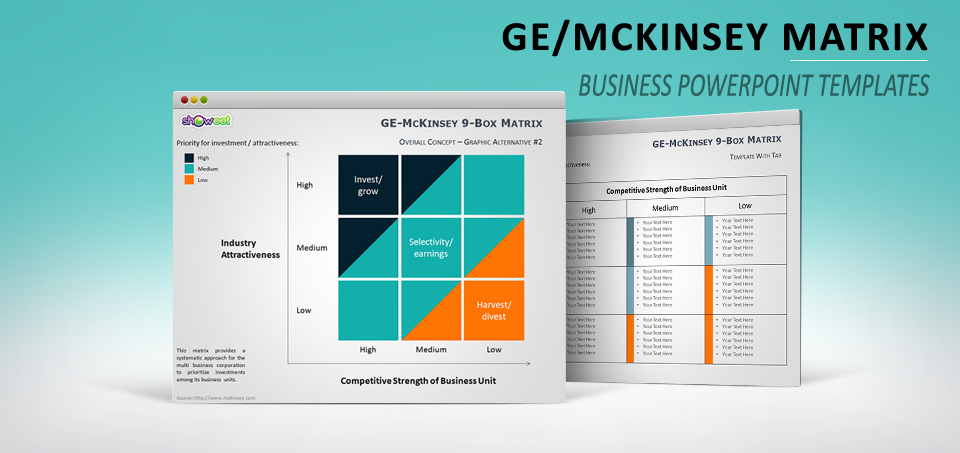
Free GE/McKinsey matrix templates for PowerPoint. Presentation document that contains 8 slides: 3 alternatives of colored graphic matrix, 2 slides with the nine boxes explained, 2 templates with (and to be used with your own) data-driven graphs and 1 template using a tab.
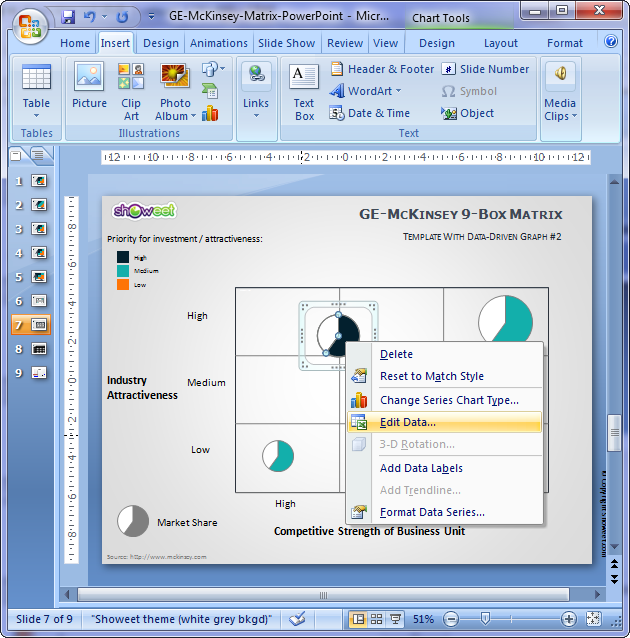
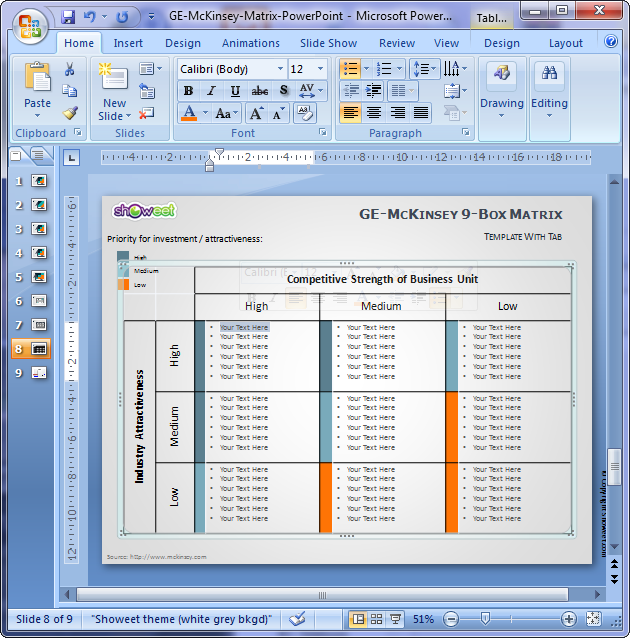
Developed by McKinsey & Company in the 1970s to help General Electric prioritize its investments in its numerous business units. The nine-cell portfolio matrix is a widely used tool in business area or consulting to help companies screen large portfolio of strategic business units or for the evaluation of investment opportunities as part of product portfolio management.
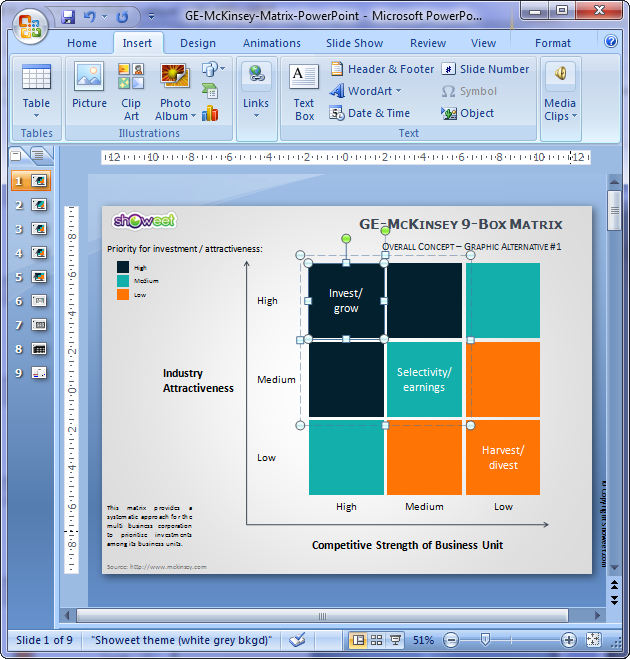
Business units or opportunities or priorities are overall categorized as “high”, “medium” or “low”. The two axes of the matrix are the “Industry Attractiveness” and “Competitive Strength of Business Unit”.
Source: mckinsey.com
Presentation Package includes:
- 8 slides
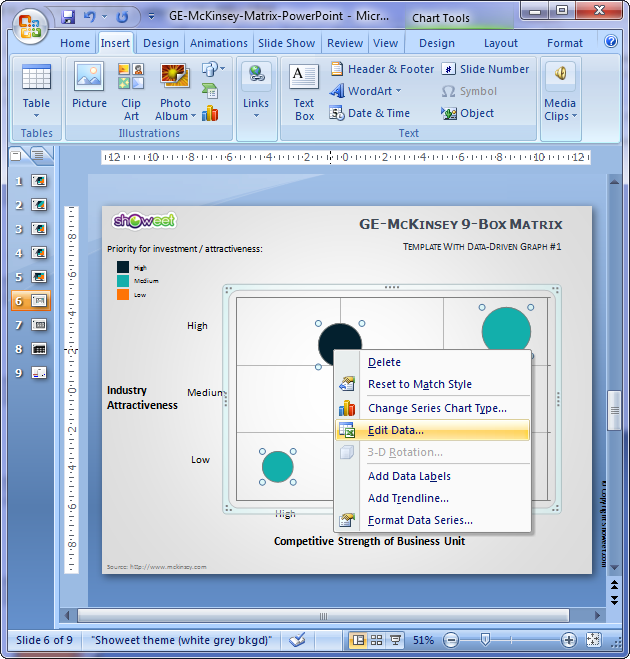
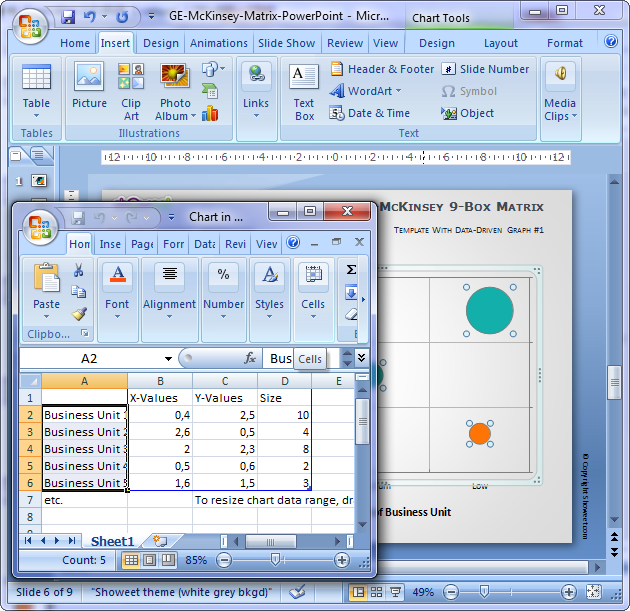
- Editable graphics (to easily customize colors and size)
- Font Used: Calibri
- Format available: PowerPoint 2007-2013 (.PPTX)
- Licence: Creative Commons Attribution-NonCommercial-ShareAlike 3.0 Unported (CC BY-NC-SA 3.0)
Slides included:


Features and how-to’s:
perfectly prepared