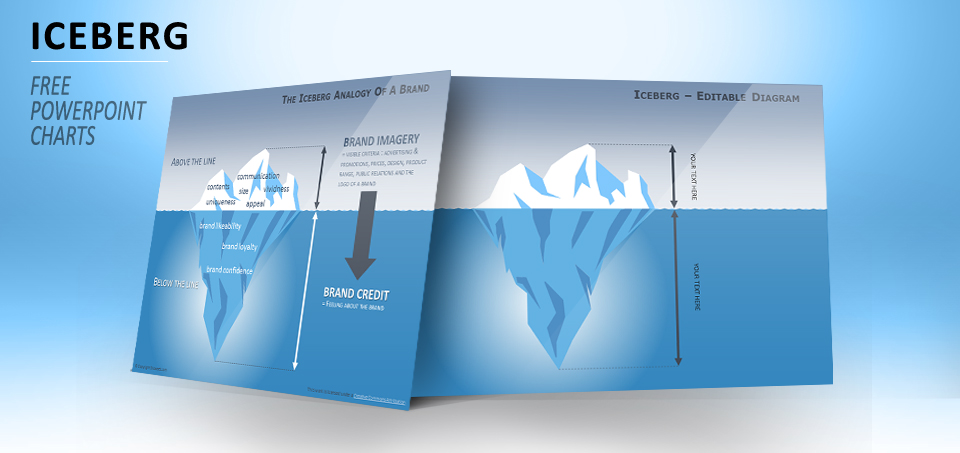
Free iceberg diagram for PowerPoint. Used in various fields (marketing, management, psychology, human resources, finance) the iceberg model is an analogy that allows to illustrate opposite or dual concepts: visible vs. less visible/hidden, conscious vs. unconscious, perception vs. emotion, known vs. unknown, etc. Includes 3 slides, with editable shapes and with 2 concrete examples: “The iceberg model of meaning”, and “The iceberg analogy of a brand”
Presentation Package includes:
- 3 slides
- Editable graphics (to easily customize colors and size)
- Font Used: Calibri
- Format available: PowerPoint 2007-2013 (.PPTX)
- Licence: Attribution-NoDerivs 3.0 Unported (CC BY-ND 3.0)
Slides included:


Great, works super fine! Thank you
This iceberg, as drawn, would float the other way up. The majority of an iceberg’s mass is under the water – I.e it floats ‘heaviest part down’. I feel that the visual/technical mistake detracts from an otherwise very nicely drawn graphic. Thanks, Sam
Great graphic with everything adjustable – you can increase or decrease all the proportions so it can satisfy those who study physics and want it to float as well as those who are just trying to provide a visual support to a concept
thank you